Report type – Code table by code table
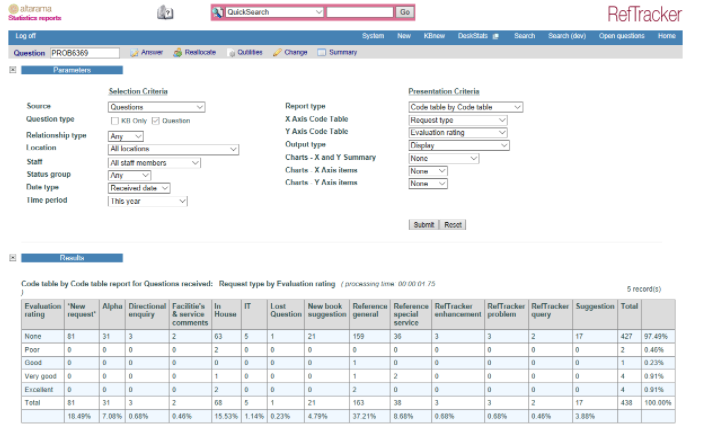
The Code table by code table report shows the Y axis code table you have chosen on the Y axis (in this case Request type were selected), and the X axis code table that you have chosen on the X axis (in this case Staff was selected).
It allows you to analyse the questions for your selected period by two features (three if you count Locations!) – for example “how many questions, of what types, were handled for each client department supported by the library during the reporting period”, or “which staff members were primarily responsible for the work done for each client department during the reporting period”.
The Code table report is available for all data sources: Questions plus DeskStats, Questions, DeskStats, and Client.
Remember that the meaning of the code tables you are analysing is as you have used them in your system. Go to the Code tables screen and view the description/contents of each code table to recall why each field is used in your library, to determine what analysis can be done using this screen.