Report type – Time period by time period
The Time period by time period report provides information about trends over time.
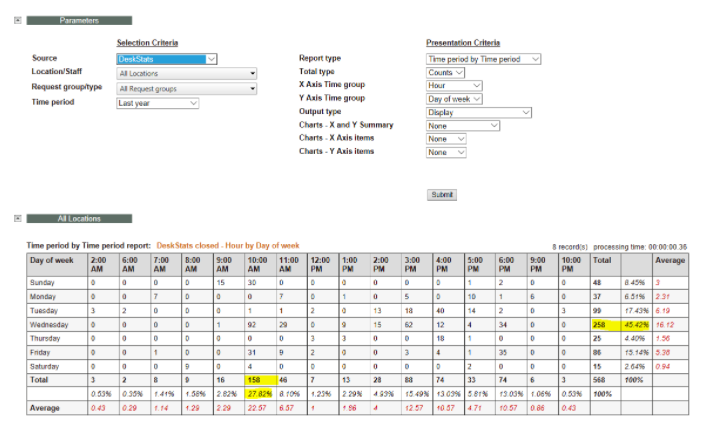
The parameters to this report allow a range of time periods to be selected, but a commonly run report is Hour x Day of the week, which, for the selected period, will give an indication of question volumes (with Total type set to Count), and relative staffing levels required for each hourly period throughout the day (with Total type set to Time).
Doing this report for a one week period will show transaction levels by the hour for that week. Doing this report for a 12 week period will show the total volumes for that period (divide reported numbers by 12 to get a one week average). Don’t forget to use the Location/Staff member parameters if you are trying to obtain statistics for a particular team or service point.
The Time period by time period report is available for the DeskStats, Questions, and Questions and DeskStats data sources, allowing separate analysis of your different services, or an overall analysis. Importantly the Total type parameter set to Time provides even more interesting information as it is not just showing the number of customer interactions, but how much staff time was used for that workload – an even better measurement of just how busy the service point was! Note that the report title includes “Total type: Time used” to clearly indicate that the totals in this report are minutes spent with the clients, not just counts.
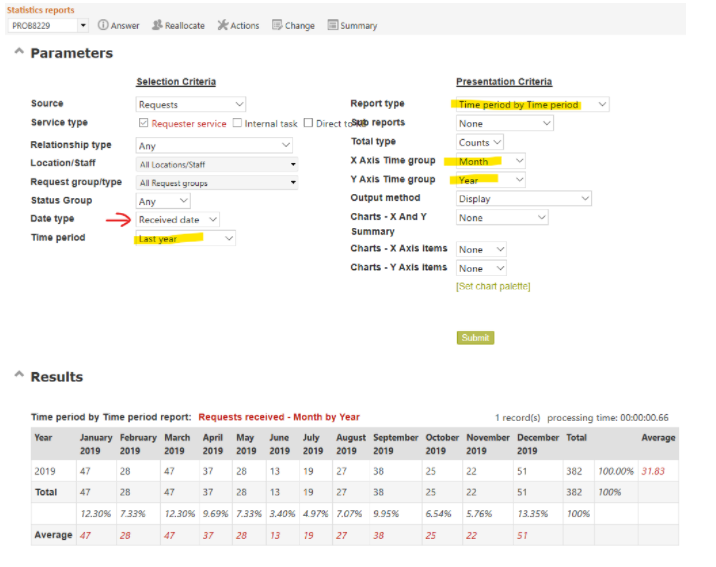
Another common use of this report is for trend analysis. Try this report (for either Received date, or Closed date) for “this year” and then “last year” to see how your service usage changes over time. (Use Excel to obtain a graph in month order as RefTracker’s graphs will provide the columns in value order) :