Report type – Time period by code table (Export(Excel spreadsheet, CSV, or XML))
Because we chose the Display output type in the report above, it was presented in the RefTracker screen.
Using the same parameters with just the Output type parameter changed to one of the Export options, the system will ask if you want to open or save the downloaded data.
There are three formats available for exporting data:
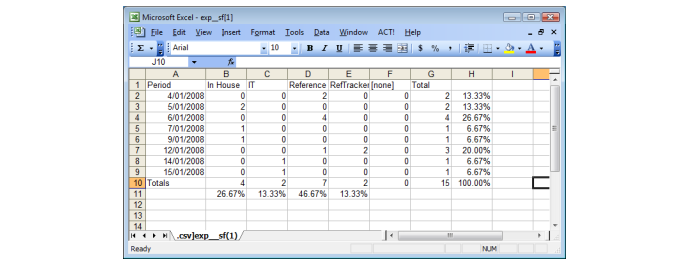
Export (Excel spreadsheet): This output is specifically formatted for Excel, and automatically downloads for opening with Excel.
Dates and times are in the time of the logged on user and appear in a human readable format that is compatible with Excel e.g. 1/01/2016 11:13 AM.
Excel cannot support HTML formatting so some HTML formatting is removed for display in Excel – for example hyperlinks in this Excel display can be copied and pasted into a browser to view but cannot be clicked directly in Excel (to see the formatted data and use hyperlinks in the data view the Display output option).
However there is a hyperlink back to the question in RefTracker that can be clicked.
Export (CSV): This output provides International standard CSV format – for use by other applications. Dates and times are in ISO standard which means that the dates are in the date and time of the logged on user, but also show the UTC offset (in the format YYYY-MM-DDTHH:MM:SS+hh:mm where hh:mm is the offset) e.g. 2016-01-01T22:13:37+11:00. HTML coding used in data fields is included as encoded data as it is generally used for computer to computer transfer of data.
Export (XML): This output provides International standard XML format – for use by other applications. Dates and times are in ISO standard which means that the dates are in the date and time of the logged on user, but also show the UTC offset (in the format YYYY-MM-DDTHH:MM:SS+hh:mm where hh:mm is the offset) e.g. 2016-01-01T22:13:37+11:00. HTML coding used in data fields is included as encoded data as it is generally used for computer to computer transfer of data.
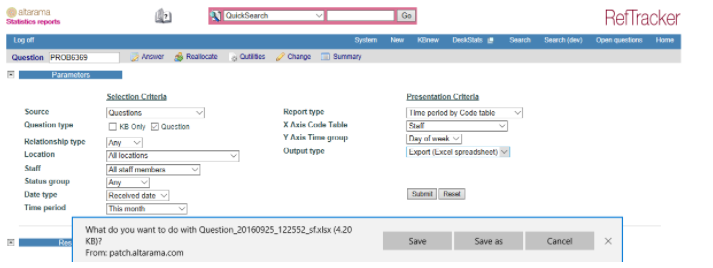
Choosing “Save as” brings up a standard Microsoft Save box that allows you to choose where the file will be saved.
Choosing “Save” saves to your normal download location and provides an option to Open. If you selected “Export (excel spreadsheet)” the quantitative summary that “Display” shows on the screen, will display in Excel where you can undertake further sorting, reformatting, etc.
Note that some reports are too wide to be printed directly from within your web browser, and Export (download) to Excel provides a means of being able to print these wider reports. You can also cut and paste the report from the RefTracker screen, into Word processing and print from there.
If you have chosen Each location, or Each staff member, the system produces one report for each location or staff member. The Excel, CSV and XML Export mechanisms can only deal with one report and so will only provide results for the first location or staff member. For this reason it is really only appropriate to use Each location or Each staff member with the Display output option.
Results in Excel – Graphing and totalling
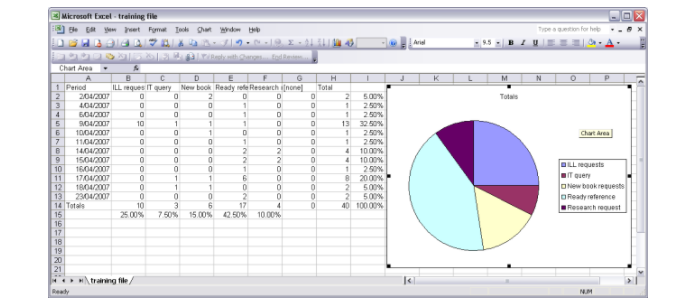
In Excel you can use the normal Excel functions to total, analyse, and graph the summary statistics and/or raw data that you have exported, in more ways than the inbuilt reports and graphs in RefTracker allow.
All types of reports can be exported and graphed like this, so lets now look at some of the other types of reports.