DeskStats Electronic Tick/Tally Sheet
Now let’s look at DeskStats, the electronic tick sheet. You find DeskStats behind the DeskStats icon in the main header bar.
A popup menu appears when you cursor over the deskStats icon showing three options:
DeskStats (sub window) will open DeskStats in a sub window that you can position on your screen so that it is visible while you use other RefTracker functions and other applications.
DeskStats (new tab) will open DeskStats in a new tab of the same browser you are using RefTracker in. Some users find it easier to work with DeskStats in the clearly labelled separate DeskStats tab.
DeskStats (this window) will open DeskStats in the main RefTracker window with the RefTracker navigation bars above it so you can move to other functions in that same window when you are finished with DeskStats.
No matter which usage mode you choose, the next time you click the DeskStats icon itself, DeskStats will open in the mode you last chose.

Many reference services answer a high proportion of their enquiries via a single face to face (or phone) short answer service. Traditionally statistics for this sort of service would be recorded using a paper tick sheet.
DeskStats provides an electronic equivalent of the tick sheet that is quick and simple to use, yet provides more detailed statistics than a traditional tick sheet, with the added advantage of having the information automatically stored electronically for easier statistical analysis, with no tick counting!
For most users DeskStats opens in a separate window or tab when the DeskStats link in the main header bar is clicked. It can also open in the main window, and a special level of user known as a ServicePoint user is designed to do that by default in order to make DeskStats more efficient for use at service points where the vast majority of services provided just need a DeskStat recorded.
DeskStats level signons can easily be used on tablet computers, or even mobile phones, for mobile staff like Rovers. A Touch screen mode can be selected to present the DeskStats data entry grid with slightly taller rows so they are more easily touched.
Use DeskStats to record statistics for services delivered on the spot (services where no follow-up work is required). This might include the sort of short answers that are provided at service desks, by phone operators, and for any service that might be provided via social media or desktop sharing.
The following description uses the DeskStats layout provided as a separate window in the default layout. All information presented in this section is equally relevant to Full and DeskStats level users, however, as shown in the Staff signon description early in this section, DeskStats level users also have an included header bar that gives them access to other functions such as the New function that allows them to refer questions that cannot be answered on the spot, to other staff members.
DeskStats introduction
Exercise:
Click on DeskStats in the RefTracker Main header bar to bring up the DeskStats function in a separate window, or, if you prefer it to not be in the same window as your main RefTracker window, but in a separate tab of the same browser, click “DeskStats (in tab)” in the body of the Home page. Your DeskStats will not look exactly like the screen above as it can be tailored by your System Administrator to meet your organisation’s needs (System administrators should see RefTracker staff interface customisation)!!! You can also tailor it to meet your own personal needs and how to do that will be explained later in this page.
To use DeskStats just select any values in the screen that need entering and then, in Batch mode click a Save button, or in Live mode just click the relevant data entry grid box.
If there are no data entry grid (boxes) showing, your DeskStats is yet to be set up. See “Tailoring the DeskStats screen to be efficient for each user”, further down this section, for how to do this.
DeskStats opens into a separate window/tab so that no matter what other work you are in the midst of doing, you can always record a short service statistic by going to the separate DeskStats window.
The DeskStats electronic version of the traditional tick or tally sheet can be used by both Full and ServicePoint users. There is even a special level of ServicePoint user where the DeskStats functionality is presented in the main staff window, rather than in a separate window/tab, on the presumption that this level of user, primarily just uses DeskStats.
DeskStats is used to record statistics about questions that are answered on the spot. If follow up work is required, use the New function to capture details of the request and work to be done on it. When the New function is used, statistics are automatically gathered, so a service only needs to be recorded in one of DeskStats or New to gather its statistics.
If your organisation uses both DeskStats and Full questions, every service you provide should be entered as either a DeskStat or as a full question, whichever is most appropriate to that service, in order to obtain complete statistics about your service provision. When a new full question is created (e.g. by using New), statistics are automatically gathered for that question – there is no need to separately record statistics for that question in DeskStats. Statistics are also automatically gathered for requests that arrive through RefTracker forms in your web pages, and through emails imported into RefTracker. DeskStats should be used to record a statistic for all services you provide that do not get entered in full.
Some request answering services only worry about short service statistics during audit periods, and others do it continuously. With DeskStats you can operate in either way as long as your staff all clearly know what service statistics are being measured, or not, at any point in time.
The DeskStats screen can be tailored to suit the needs of each request answering service and each RefTracker staff member, including which mode (Live or Batch) they prefer to use, and the order of presentation of the different parts of the DeskStats screen. The screen remembers how you used it last and reopens in the same mode, and with the same Request groups expanded, the next time you use it.
So let’s become familiar with the layout of the DeskStats screen.
Using DeskStats on a touch screen
DeskStats is easily used on all types of devices and is often used on a tablet by library rovers. To make it easier to use on devices with touch screens, be they mobile devices like tablets, phones, or desktop computers with touch screens, the DeskStats screen provides a “Touch” option. To use the touch option just click the “Touch” button in the top line of the screen. Your staff will love the efficiency of using DeskStats on a touch screen!

Your DeskStats screen will redisplay with data entry grid lines that are taller, and so easier to use with a finger. The screen will remember if you last used “Touch mode” and present it that way again next time you use DeskStats.
To turn off “Touch” mode you will find a “Standard” layout button in the same place that the “Touch” mode button was presented.
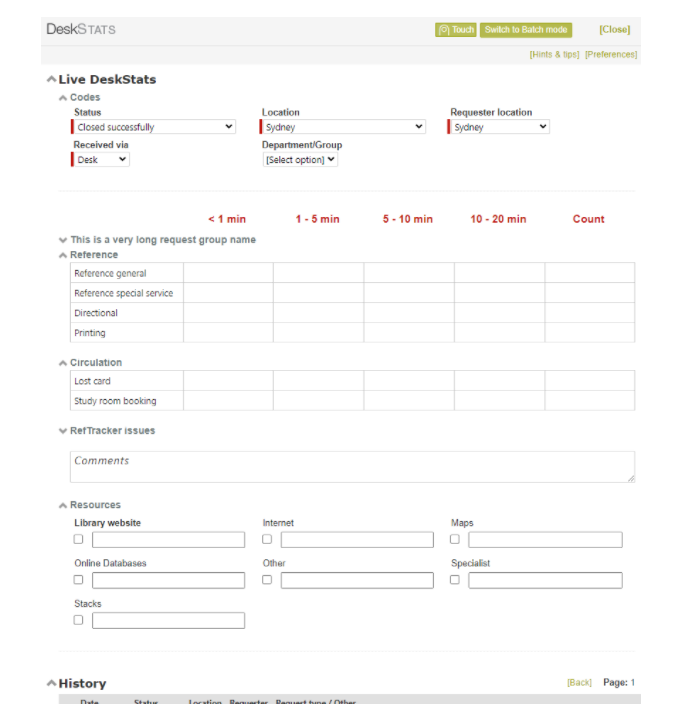
DeskStats: Where to find things
This is an example of what DeskStats can look like once it is tailored to your needs. The numbers in the following list refer to the numbers in the screen print above:
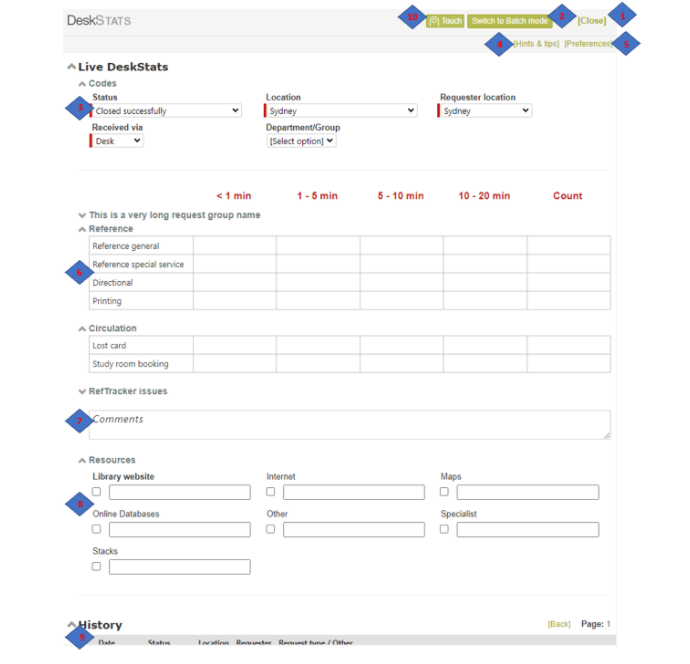
- [Close] for closing the DeskStats sub window.
- This screen has two modes – Live mode for entering statistics as they happen, and Batch mode for entering them from a tick sheet sometime after a reference shift has concluded, or as a catch up when you’ve missed some during a shift, or even so that you can easily enter more that one of the same type of service statistics. The mode button (2) allows you to change between modes. DeskStats will open in the mode (Live or Batch) that you last used it.
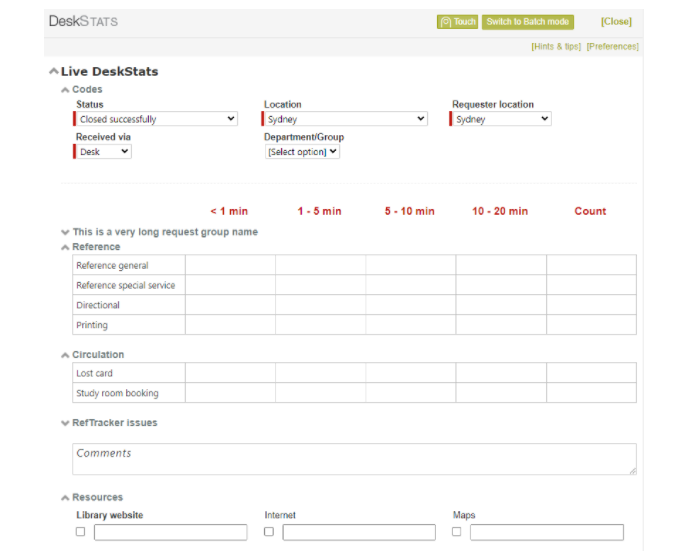
The mode button allows you to switch between Live and Batch modes, if your System administrator has allowed you to do this (controlled by the DeskStats settings in the Function tab of each user’s signon). - The Codes drop down boxes section allows you to record specific information about the question you have just answered e.g. what Staff location the statistic occurred at (your DeskStats preferences set the default value for this), what Client location the client came from, if you use this concept (your DeskStats preferences set the default value for this), whether it was answered successfully or not, whether it was taken at the desk or by phone, etc., (your DeskStats preferences in My preferences set the default value for this).
Your organisation can also specify other fields that they feel are important to their statistical gathering, that can appear in this section e.g. Practice group or Department
Where the entry of a value in relation to a field in this section is optional, the field will display without a highlight bar and with [select option] as the default value shown in the drop down box. If you do not select any other value, nothing will be recorded for this field.
If a field in this Drop down boxes area is set to Mandatory, it will be displayed with a coloured bar to the left of that field, and with the Default for that Code table already showing. The coloured highlight bar serves as a reminder that even though this field may have been defaulted to a value, it is important to review the value showing, and amend it if necessary.
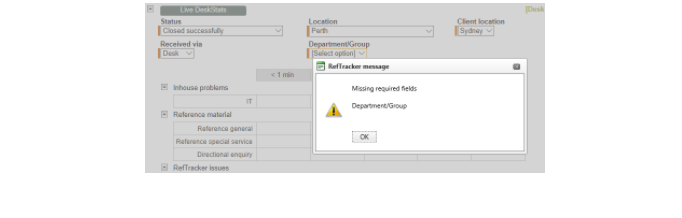
If one of these drop down boxes area is set to Required, it will be displayed with a coloured bar to the left of that field, and with [Select option] showing. The coloured highlight bar serves as a reminder to enter a value in this field BEFORE recording your statistic. If a value is not entered, a pop up will display and the surround of the Required field will be highlighted to indicate that the value must be entered before the statistics can be recorded.
Select the values that you need recorded in this section, before recording your statistic.
Your System Administrator can determine the fields that show in this section using System/Data dictionary/DeskStats data. They should set them to Optional, Mandatory, or Required in System/Data dictionary/DeskStats data according to how they want them to operate. If you no longer want a field to display in this area, your System administrator should set it to Disabled in System/Data dictionary/DeskStats data. - DeskStats hints & tips: if this is provided in your system you can click it to obtain information about your organisation’s policies for using DeskStats. It usually contains information about what sorts of requests should be recorded in each Request type row (System administrators use parameters 4.20 and 21 to add, or remove, and customise this feature.)
- Expand Preferences to set how you want your DeskStats to display for you. See a following section in this page for more details.
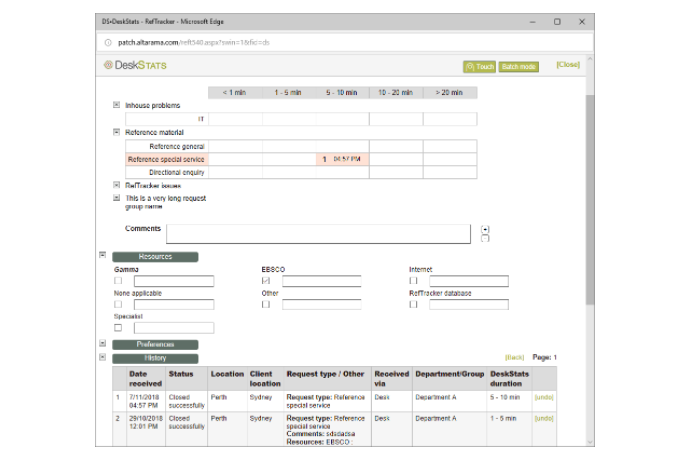
- The DeskStats data entry grid contains a subset of the types of questions that you may be asked (as defined by your System Administrator using the Request type and Groups codes tables). In DeskStats preferences (see later on this page) you can define which subset you see. The column headings in this section define the time taken to answer these sorts of questions, or a count. They are determined by your System Administrator using the DeskStats duration code table.
To record a statistic you simply need to click in the appropriate grid box (row and column). To make selecting the right box easy in live mode, the Request type name bolds and the box your cursor is on shows in a highlight colour. In both Live and batch mode, a tooltip showing the column heading shows if your cursor stays on the box for more than a second (handy if the column headings have scrolled off the screen). The tooltip goes away if you move your cursor away from that cell.
To show the grid boxes for a particular group of question types click on the next to the group name, and to remove the grids, click on the
  next to the question group name. DeskStats remembers the groups that you have open and displays next time with the same groups open.
Clicking on a box in this data entry grid will record the DeskStat statistic for the question you just answered (i.e. it acts like a “Save” button), so be sure to have made all other selections on this screen before clicking in the appropriate box. As your cursor moves over boxes that can be used to record a statistic, the box will become coloured. This helps to ensure that you are clicking in the most appropriate box. Any values that you have selected, or entered, in any other sections of the DeskStats screen, will be returned to their default values after you record a statistic.
Rows of this grid usually provide options for the different types of Requests you can record, grouped into like activity types. There is no limit to the number of rows that might appear in your DeskStats.
The columns usually indicate time spent or quantity. Your System administrator may have set your DeskStats up with 1, 2, 3, 4 or 5 columns. For example, here is what DeskStats could look like with only two columns: - The Comments field in this section can be used for collection development comments, or to more fully describe the subject of your question, and other purposes as set by your organisation’s local policies. Comments may have been set as mandatory for completion with every statistic recorded (in which case it will have a highlight colour label that includes “(required)“), it may be optional for completion, or it may have been removed entirely. You can enter up to 2 million characters in the Comments box and dragging the bottom right corner of this box will increase its size so larger comments can be more easily entered.
The My DeskStats function, accessible from the Home screen, (and the DeskStats report screen under System>Reporting) provides an option to be able to search the DeskStats Comments! - The Resources section (if it has been configured for use in your system) allows you to record statistics about the Resources that proved useful in researching this question. Your System Administrator sets up the Resources showing in this section using the Resources code table. Different Resources may show in DeskStats to those that show in requests and internal tasks.
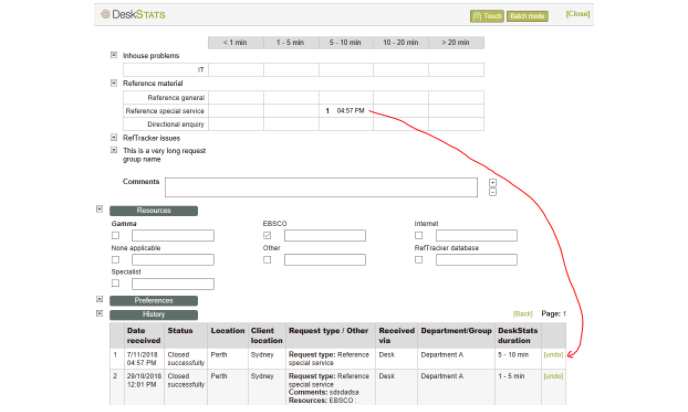
Check the small box, or type details into the larger box (up to 2000 characters) of as many Resources as are relevant to the response you just provided. If this field is mandatory for a required symbol, and not that at least one resource must be ticked will appear to the right of the Resources heading. - The History division shows a summary of the last 10 statistics that you recorded, so that you can check what you recorded. Optional fields like Comments are shown in the Request type/Other column. Importantly, it includes the Undo link that allows incorrectly entered statistics to be removed so they can be replaced with a correct entry.
If you find that you did not record the correct details, or all the details that should have been recorded for a particular statistic, you can Undo that History entry by clicking the [undo] link beside that entry. If you want to correct an entry, Undo it and simply record another to replace it.
This same information is provided in a wider screen format, with all information in separate columns, in the My DeskStats function accessible form the Home screen. My DeskStats is a good place to look if you want to see more than the last 10 entries, but this History division in the DeskStats screen does include a [Back] link that can be used to see (and undo) entries further back than that.
Mistakes can also be corrected by Administrators – only Administrators can enter negative numbers in DeskStats batch mode, in order to make corrections. When entering a negative number to make a correction, Administrators should make sure that ALL of the other attributes of the statistic you are recording, are identical to the record that you want to correct so that the correction balances out all aspects of that statistic – Date, Time, Location. Request type, Duration, etc. - Click the Touch or Keyboard button according to how you want to use this screen. Touch makes the Data entry grid boxes large enough to easily record entries with your finger on a touch screen. Keyboard provides a small er grid that allows more to fit on the screen and is usually used with a mouse.
Tailoring the DeskStats screen to be efficient for each user
In the DeskStats data entry grid area, click the icon sign next to the Request group names that correspond to the types of questions that you answer regularly. This will open up the data entry capture grid showing the various request types within that group. Having the icon showing next to all the groups that you do not answer regularly means they take up minimal space, but can still be opened on the odd occasion that a statistic needs to be recorded in that group. DeskStats will remember which groups you last had open and present your screen using that layout again next time.
The system remembers the size of the DeskStats screen and presents it the same size as you last used it, so if you need it to be a different size, pick a corner of the browser window and drag it to the size and shape that suits you. The next time you record a statistic, the shape and size you have selected will be recorded, and in future, DeskStats will be presented using that size and shape each time you load, until you choose to re-size it again.
Tailoring the DeskStats screen for your prefernces – DeskStats preferences
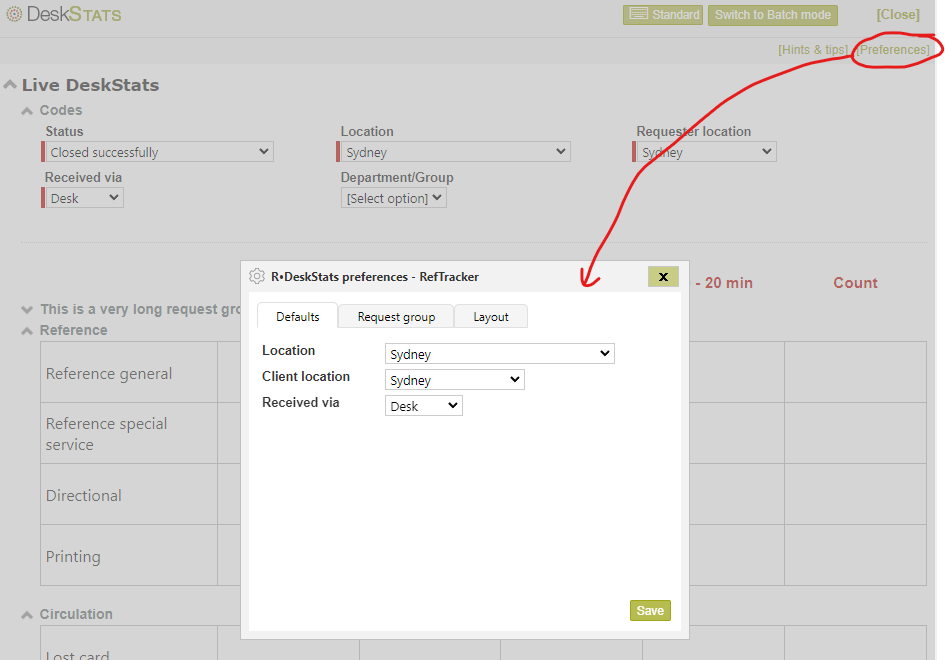
In the top right of your screen you may see a [Preferences] link. It allows you to set you default values for DeskStats and your default layout.
If you have been allowed to use this function (shared signons like those used at Service Points are usually not allowed – your System administrator controls by denying that function in your user signon), you will see a display similar to the one above. All of the things in this window can also be set using the DeskStats preferences tab of My preferences under Home. The following options can be configured:
The Defaults tab:
Staff location – Allows the default value for the Staff location drop down box in DeskStats to be set for this user. It can be reset here if the staff member is rostered on to a different location. If you make a change here, you may also need to change the Client location setting below. This Staff location setting refers to DeskStats only, and may not be in use in your system. Your Staff location for full questions is separately set using the Contact details tab of My preferences.
Client location – Allows the default value for the Client location drop down box in DeskStats to be set for this user. It can be reset here if the staff member is rostered on to a different location where the most common location of the clients is likely to be different. This may not be in use in your system, and if this field has been set to Required in DeskStats by your System administrator, that option to ensure a value is selected every time, will override any value that you set here.
This Client location default setting refers to DeskStats only. Your Client location default for full questions is separately set using the Answering preferences tab of My preferences.
Received via – Allows the default value for the Received via drop down box in DeskStats to be set for this user. It should be set to the most common way that requests arrive when this user is recording DeskStats. This may not be in use in your system, and if this field has been set to Required in DeskStats by your System administrator, that option to ensure a value is selected every time, will override any value that you set here. This Received via setting refers to DeskStats only. Your Received via default for full questions is separately set using the Answering preferences tab of My preferences.
The Request group tab:
To remove a Request group from your DeskStats display because you will never provide any of the services in that group, uncheck the tick box to the left of the Request group/s you want removed. It is a good idea to remove all the Request groups that you do not handle as on the spot/short service requests (i.e. Request groups for which an answer is never provided whilst still working directly with the client). Removing groups you do not use provides a shorter list and so reduces scrolling around your DeskStats screen.The Request group tab:
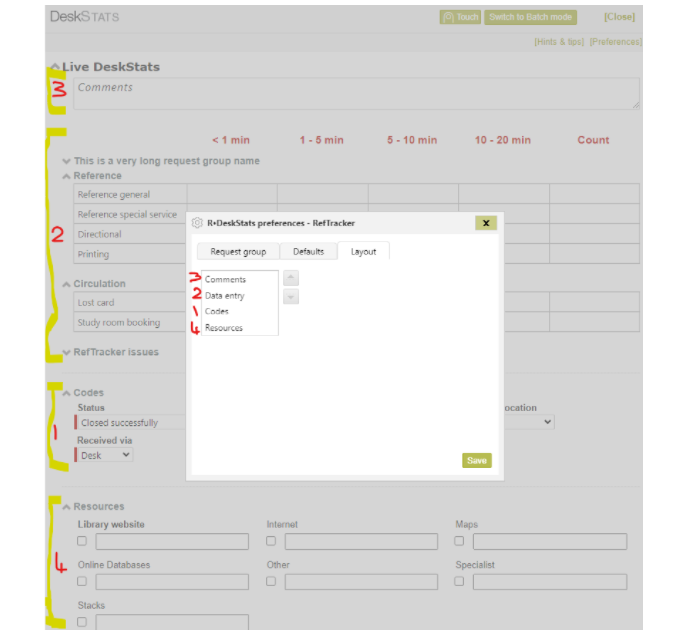
The Layout tab:
This tab allows you to move the different parts of the DeskStats screen around on the screen so that the one you use first can appear at the top of the screen, followed by the one you use next, etc. Drag and drop the different section names into the order you want them to display. Note that the History section does not apper in this list as it will always appear at the end of your DeskStats screen.
When you have made all of the changes you want in all of the tabs of the Preferences subwindow, click on Save, and your DeskStats screen will redisplay without the Request groups that you just configured out. The [Preferences] function can be used at any time to ensure that RefTracker has saved any customisations that you have made to the screen without having to have saved a statistic.
Exercise – Other things for you to try:
- Try setting Request groups, defaults, and your DeskStats screen sections to suit your needs.
- Now that you have tailored this screen to meet your specific needs, it’s a good idea to keep a print of it handy to mark up with statistics that occur when RefTracker is offline. Use Batch mode to enter the stats from this sheet, when the system comes back on line.
You now have a DeskStats screen that is ready to use.
DeskStats live mode: One click statistics
Now that you have tailored your DeskStats screen it will look something like this – in Live mode (Batch mode is discussed later).
As you move your cursor over the Request type/time taken grid, the grid elements will show as highlighted.
Statistics can be recorded as simply as with one single click when the highlight colour (apricot in the above example) is in the most appropriate Request type / time taken grid box. Be sure that you check the values that have been entered into any highlighted fields in the Drop down box section BEFORE you click a data entry box.
After you click, the DeskStats screen may briefly show a “Progressing request” image to indicate the data is still being transmitted, and will then redisplay showing that 1 (more) statistic of that type has been recorded and the time at which that last statistic was recorded e.g. 10:39am. You can check this time against the local time on your computer if you are unsure as to whether you just recorded a statistic.
Note that if you make a mistake, you can use the Undo function in the History section to remove that statistic so it can be correctly re-entered (more about “Undo” later).
Exercise:
If your system includes the DeskStats Hints and tips link on the left of the column headers, click it and become familiar with the information it provides – it may provide information about your organisation’s policies covering what row in DeskStats should be used to record each different type of service you provide.
Record a simple statistic by simply clicking on one of the reference grid boxes e.g. Database access / 1-5 minutes. Confirmation of your statistic being recorded will be provided by a higher number and the current time being displayed in the box in which you clicked.
By doing this you have recorded:
- that you (as opposed to any other staff member) performed the service (as the system knows who is signed on)
- at your branch (Staff location value)
- it was a Database access info type question (or whatever type of request your selected)
- it took 1-5 minutes to perform the service (or whatever time period/count you selected)
- it occurred at 11:59am (or whatever time you made the click)
- the question came in over the desk (or whatever Received via value you selected)
- it was successfully completed (or whatever Status you selected)
- but no specific resources were recorded as being used (or whatever Resources you recorded as being helpful)
- and no comment was recorded (or whatever you entered in the Comments box)
Try clicking on some other boxes to record different statistics, and note the changes in display of the time that the transaction occurred at, and the question count – in other words the DeskStats screen is showing a cumulative total for all of the DeskStats that you have entered in your current RefTracker signed on session.
After you record a statistic all of the drop down boxes return to their default values and any Resources or Comments you recorded are blacked out, ready for the next statistics to be recorded.
Note that as you record statistics, a summary of the Statistic you recorded appears at the top of the History section at the very bottom of the screen. If you notice that you have recorded something that is not correct, click the [undo] link to the right of its history entry to remove that entry, so you can record it correctly.
DeskStats: recording more detailed statistics
More detailed statistics can be recorded with just a few more clicks – select values and enter data in more of the fields provided. The following exercise describes some of the ways you can do this:
Make your selections of other attributes before clicking the appropriate data entry grid box as each data entry grid box in live mode acts like a Save button.
If [Select option] is showing in any of the drop down lists at the top of the screen, no value will be recorded for that aspect unless you select another value from that drop down list.
If the field has a coloured block to the left of it, the field is mandatory for completion and may have been defaulted with a value that needs to be reviewed.
If the field has a coloured block to its left, and it has [Select option] showing, this field is required and a value MUST be entered for it before a statistic can be recorded. If a value is not entered, a pop up will display and the surround of the Required field will be highlighted to indicate that the value must be entered before the statistic can be recorded.
Exercise:
Drop down Status and choose a different close status e.g. “redirected” – i.e. you had to refer the client to another organisation for an answer.
Drop down Received via and indicate a different method of receipt e.g. phone.
If your organisation has included additional drop down boxes at the top of the screen, drop down each one and choose appropriate values for them, if they are appropriate to the statistic you are recording. The values showing in these drop down boxes are the values that will be recorded with your statistic.
Add a Comment e.g. a collection comment such as “We need more books on digital photography”, or a summary of the question such as “Cases on personal injuries in railway stations”. If this field is mandatory for completion a Required symbol (usually a tick) will appear to the left of the field name.
If your library has configured Resources into this screen, indicate some Resources used in answering this question. Note that this can be done by a simple click in the small box, or via a text description in the large box associated with each Resource type. If this field is mandatory for completion a Required symbol (and note about at least one field needing to be completed) will appear above the Resources entries.
And then finally, when all choices have been made, click on the appropriate grid element to record the statistic e.g. Reference general/10-20 minutes for example.
With this selection you have recorded, for example, that you performed the service, at your branch. It was a research level reference type question and took 10-20 minutes to perform the service. It occurred at 11:23am (or whatever time you made the click). The question came in by phone, it was finally resolved by referring it to a third party, and three different resources types were used in answering the question.
Don’t forget that if you get it wrong, you can always use “Undo” in the History division to remove the incorrect statistical record and re-enter a corrected one.
Now try recording another statistic. Note that values you entered cleared after you clicked a grid box, and any defaulted fields have reverted to their defaults.
Your System administrator may have also set up some statistical collection capabilities using the RefTracker New screen. Forms under New are used where it is likely that more than one field in the Drop down boxes area would have needed to be set as Required. DeskStats is designed for simple statistics that can be recorded with just a click or two.
Moving in and out of DeskStats
Your DeskStats window remains active as long as your main RefTracker main window remains active – if you log out of your main window, you will no longer be able to record DeskStats.
You can move between the main RefTracker screen and DeskStats as necessary to record short service statistics that occur in the midst of your research and other work. Clicking DeskStats in the main header bar opens DeskStats in a separate window. Clicking “DeskStats (in a tab)” in the body of the Home page will open DeskStats is a separate tab if you prefer to work that way.
Here are some things you need to know to be able to serve multiple clients in this way
- If you use DeskStats a lot you can leave it open in a separate window, however, you can close the DeskStats window at any time you need to. If you open DeskStats again during the same RefTracker signed on session, DeskStats will open up showing the cumulative total of all DeskStats that you have entered in this RefTracker signed on session.
- Click on the [Close] link quickly move back to the main RefTracker screen, for example to research a question, or enter details of a question that needs to be researched. In the main screen you can quickly move to the DeskStats window by clicking on DeskStats in the Function bar. If you already have a DeskStats window open, you will be taken to the already open window. You can also move quickly between the main RefTracker screen and DeskStats by choosing the appropriate window from the Windows Start bar (the main screen is identified by R·, and the DeskStats screen is identified by DS·.
- Switch mode allows you to switch between Live and Batch mode e.g. so that you can enter someone else’s tick sheet values, or so that you can enter a batch of similar statistics e.g. your library may use this to enter a request for 6 photocopies as 6 statistics, rather than as one photocopy request.
- My preferences (DeskStats preferences tab) and Preferences in the DeskStats screen, allow you to change your default value for Received via and Staff location. You might want to do this if you are working in a different location for a shift. Always close DeskStats before opening My preferences and making any changes there. If you or an administrator make a change that would result in a DeskStat value not matching newly set system values, a popup will be presented that advises that DeskStats needs to refresh before you can record the statistic. In the rare instance where this occurs you will need to answer the question/s presented by the popup/s and then re-record your statistic – your default DeskStats mode will be presented after DeskStats refreshes.
Exercise:
Try using the [Close] link to get back to the main RefTracker screen, and then the DeskStats link in the header of the main screen to get back to the DeskStats screen.
Notice that you can even close the DeskStats screen by using the x in the top right of the browser, and when you come back into DeskStats it still shows your values from earlier in this RefTracker session. And from use to use it remembers which divisions you have open and closed so you don’t have to make your customisation changes more than once.
Enter a new statistic that has a few data elements recorded for it, then try using the [undo] link in the History area to remove the last statistic and then re-enter it with corrected values.
Try closing DeskStats, making a change to your My preferences, such as changing your default Received via value to Phone. Re-open DeskStats and note the changed default value.
When you are familiar with these functions, use the mode button in the top right of the screen, to move to Batch mode so we can examine how to use Batch mode.
DeskStats Batch mode
RefTracker DeskStats batch mode allows multiple statistics to be entered (as opposed to Live mode where every click represents just one statistic) e.g. 15 photocopies, or 20 company searches, and it can be used to enter statistics in arrears by choosing an earlier date or time. Although RefTracker Live mode is very easy to use, some staff prefer to continue using a manual tick sheet, and Batch mode allows statistics entered on a tally sheet to be included in RefTracker’s statistics and analysis sometime after the conclusion of your (the staff member’s) shift.
The Date field allows statistics to be recorded for days other than today (up to one year before the earliest Full question or DeskStat recorded in the system, or today if your system is empty), and the time field allows you to reflect the time that the service was provided on that date. During the DeskStats hours for your Location the date field will only allow times to be recorded within your DeskStats hours (to limit the opportunity for staff to select incorrect times), but if you are trying to enter a statistic at a time that is outside you normal DeskStats hours the time field offers the full 24 hour period (this is helpful for System administrators to know so that they can make adjustments for out of hours times).
DeskStats hours are set for each staff location at System>Locations. Use the Edit function to see and edit the DeskStats Start and End hours for that location. DeskStats Start and End hours should be set according to the times that your location provides “on the spot” services (such as at a service desk). They default to the same hours as your Reference staff’s working hours, but you can set them to a wider range, including 24 hours, if applicable.
Your System administrator many even have allowed you to enter statistics on somebody else’s behalf, in which case a staff name selection box will appear on the top line of the DeskStats data entry grid area.
If you change the staff member, date, or time, the system remembers that setting for the rest of your session (until you log off). This is great for entering stats on behalf of another user, but beware, if you have been entering stats on behalf of someone else, you will need to reset these values back to yourself and the current date and time, if you want to also enter stats for yourself. Details like Received via, Status and Location all automatically revert to their default values after a stat is recorded, even when Staff member, date and time are being remembered.
Although this screen looks similar to Live mode, it works by entering a numerical count of similar transactions and then clicking on Save, rather than by just clicking in the request type/time grid for each individual statistic. The screen is then redisplayed for further stats, with different characteristics, to be entered. Save buttons are provided on every Request group line to make it easy to access a Save button. You can use any Save button. You must enter at least one numeric in the data entry grid to be able to use the Save button.
Note
1. Your screen may display with all Request groups contracted which will mean no data entry boxes are showing and no Save buttons are showing. Click the appropriate Request group expand button to show the data entry boxes and Submit button/s.
2. When you enter more than one number in the data entry grid and then Save, RefTracker actually saves that number of statistics each with the same value for all the other characteristics e.g. Closing status, Received via, Comments, etc. So, you need to be careful when making multiple entries in batch mode – for example, if you enter a comment in the Comments field in Batch mode, then record a reference question of less than 1 minute, and another of >20 minutes, the comment will be attached to BOTH of the statistical records generated when you click on the Save button. So be sure to enter only 1 statistic at a time when you need to enter a Comment or other specific characteristic in Batch mode.
3. After the Save function in DeskStats Batch mode is used all changes that you made in that screen are cleared and you are re-presented with the screen showing a cleared screen with your default values where defaults are provided (except for the Staff member, date and time fields that will remember the value you last entered and redisplay that until the end of your session (until you log out).
On re-display of the screen after entry of statistics in Batch mode, the History section at the bottom of the Batch mode screen will have added entry/ies that summarise the statistics that you just entered. The history section provides confirmation of the statistics that you recorded, allowing you to use the [undo] link/s to remove the recorded entry/ies and re-record correct ones.
Save your Batch DeskStats regularly
Although you can enter multiple statistics in your DeskStats Batch mode screen over a period of time it is not a good idea to leave the screen sitting with unrecorded statistics in it for long periods of time as they can be lost if your computer goes down or you have an Internet disconnect. So use Save regularly! If you leave the screen inactive for 19 minutes the system will automatically save what is on the screen (unless the system determines that some data is missing and a validation message would have to be displayed – such as if Comments have been set to mandatory).
Another good reason to Save regularly is that the drop down boxes like Comments and Resources that you have selected apply to ALL statistics showing on the screen, so you need to Save before recording another statistic with different attributes, if any of these things have changed.
If you are unsure of what has been saved you can review the History at the bottom of the screen.
Exercise:
Try recording some values such as 3 general reference questions answered in 1-5 minutes, and 1 circulation question answered in <1 minute, that came in via the Desk and were successfully closed. Note that you can also set the date, time, staff member name (if your System Administrator has allowed you to change this), and location of that staff member when taking these statistics. When you have entered all the information that you want to save, you must click a Save button – any Save button in the screen will do (a “progressing” display may appear while the data is being saved). Clicking on Save is important in this mode (as opposed to Live mode where a single click is all that is required). Then scroll down to the bottom of the re-displayed DeskStats screen and notice that as you enter stats in batch mode, a summary is provided in the History section at the bottom of the screen.
Also note that [undo] link allows incorrect entries to be reversed also works in Batch mode.
Leave the screen inactive for more than 19 minutes and note that anything that was in the screen was automatically saved so it cannot be lost.
When you feel familiar with how DeskStats works in Batch mode, you can close the window using the x in the top right hand corner of the screen, as we will now examine a new function.
How many DeskStats have I recorded?
When using Live mode, the data entry grid will show you the total statistics of each type that you have recorded since you last logged on. Even if you close your DeskStats subwindow (or move away to another screen, when using DeskStats in a full window), when you come back to DeskStats Live mode you will see totals for all the stats you have recorded in Live mode since you last logged on. In both Live and Batch modes you will also see your previously recorded statistics in the History section of the screen.
You can also see a total of all of the DeskStats you have recorded “today”, and all the DeskStats recorded for your location today, in the “Workload overview” box in your Home screen. These figures total all DeskStats recorded in both Live and Batch modes.
All details of the DeskStats you record are available for further analysis by your Supervisor and Systems administrator using the RefTracker reporting.
Your System administrator may also have given you access to the “My DeskStats” function (accessible from the Home page) that provides a summary of the statistics that you have recorded using DeskStats, in a columnar format similar to the History display, and provides a function for searching the DeskStats comments. Click here for more information about this report.
Other functions a ServicePoint user of DeskStats might want to use
Additionally, your System administrator may have given you access to the “My statistical overview” function (accessible from the Home page) that provides a number of interesting analyses of the statistics that you have recorded. Click here for more information about this report.
In your Home screen, you may have access to the “Answers” sub window that can be used to find answers in the RefTracker Knowledge base – either the ability to search the entire history of work done in RefTracker, or just work specifically marked as in the KB or FAQ because they are quality answers. Click here for more information about using Answers.
In your Home screen and in your main header bar, you may have access to “New” and its forms for collecting information about questions that cannot be answered on the spot. When you cannot answer a question in the spot, use one of these forms to submit the details of that request so that your research staff can provide a response at a later time. Click here for more information about using the forms under New.