The Summary screen
The Summary screen presents all the currently known facts and historical information about the current question using four tabs:
- Details – shows all the currently known facts for this question.
- Correspondence – shows the correspondence trail for this question.
- Journal – lists just the time and cost transactions that have occurred in relation to this question (this tab may have been configured out of your system).
- Resources tab – summarises the Resources used in relation to this question, if Resources are enabled for the Request form used for this question. This tab may have another name if you use the Resources concept for another purpose.
- History – shows an audit trail of every action that has occurred in relation to this question (the Journal and Correspondence tabs show subsets of this information, but in different formats).
Each of these tabs can be directly accessed by using the menu list drop down from the Summary entry in the Question action bar. Clicking on the  symbol after each name will open that tab in a sub-window so that you can view this information no matter what other screen you are already in.
A Question overview is presented above the tabs to confirm you are working with the right question. The overview shows this question’s Request group, Question number, Question text, Item summary and any Key attributes, Request form used for this question, Status and Allocated staff member, if any.
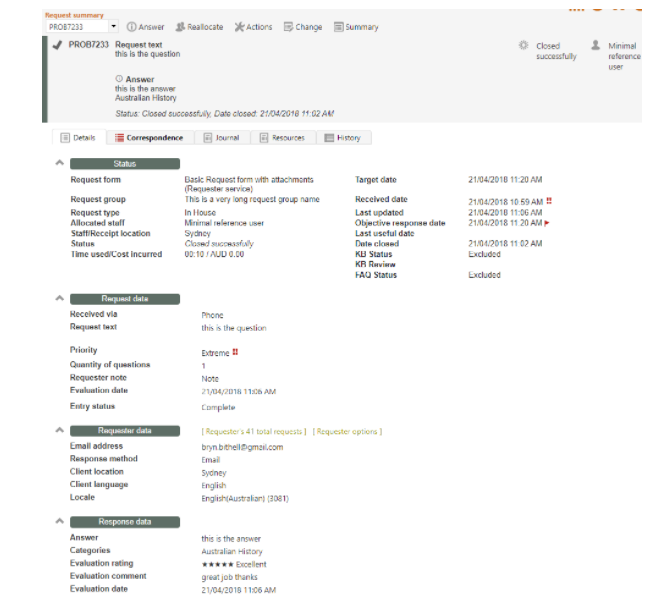
The Details tab
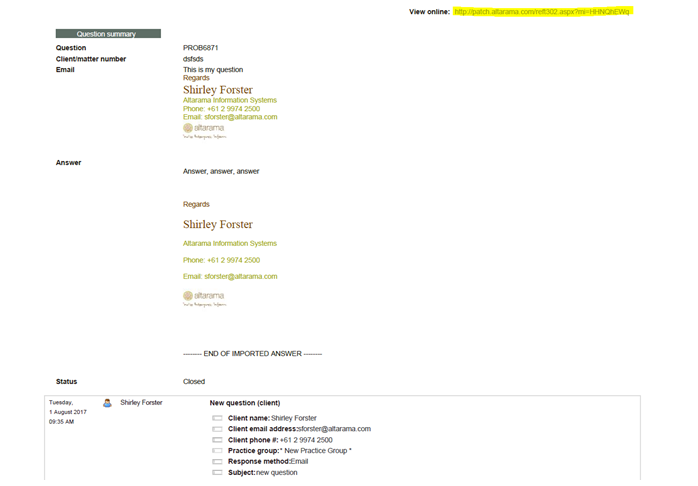
The Details tab in the Summary screen brings up the screen shown above.
You can use this screen to obtain any of the facts known about this question e.g. its current status, who it is allocated to, when it was received, etc. Importantly this screen provides the full client contact information. The known facts about a question showing in this screen are the current values for each of the RefTracker variables for this question.
The Details tab in the Summary screen is the screen presented to staff when they first begin working on a question. The facts displayed in it allow staff to familiarise themselves with the question, and decide what needs to be done next (e.g. Answer or Reallocate perhaps).
If the question is currently unallocated, and you are a user with a permission level of Probation or higher, a “Claim” button displays on every division header line in this screen. If you want to claim this question, click on any one of these “Claim” buttons – the question will be immediately allocated to you. This is indicated by the Allocation information on the right of the question summary at the top of this screen, changing to “Allocated”. The “Claim” button does not show if the question is already allocated, and a pop-up message will display if the question cannot be allocated to you as the question has been closed, or allocated to another staff member, since your screen last displayed.
Each section of this screen presents the fields from the appropriate Data dictionary table (Question, Client, Bib, etc.). Definitions of the purpose of each Data Dictionary field can be found in Appendix 1 to the Administration manual, though your uses of each field may have specific meanings as the Data dictionary is customisable by your organisation. The fields can have values as a result of data being entered into them in the Request form used to enter this question, as a result of data entered using the Changes screen or as a result of data entered during Question answering processes such as the Third party ILL workflows or closing the question.
The fields are presented in this screen using the labels defined for those fields in the Request form in use for this question so that the data is always presented in a way that makes sense for that type of question. Within each section (Question data Client data, Bib data and ILL data) the fields are presented in the order defined by the Request form, if they appear in the request form, followed by any other fields in Data dictionary order.
Information in the Details tab is organised into sections:
Status : information about the receipt and current status of this question. All this information is collected and maintained automatically be RefTracker. The information included in this section is:
*Request form – the request form used to enter this question and so the form that is determining the labels used for the fields showing in the other sections of this screen.
*Request group- the Request group associated with this question as determined by its Request type.
*Request type – the request type associated with this question as determined by the Request form it was entered with or any changes made since that time by staff.
*Allocated staff – the staff member to whom this question is currently allocated (and any reviewer involved with providing the Answer).
*Staff location – the staff location responsible for providing an answer to this question
*Receipt location – the staff location that was responsible for entering this question, or, if entered by a client, the staff location into which it arrived as determined by the Request form design.
*Status – the current status of this question. The first part is fully managed by RefTracker and reflects the last action taken on the question. The second part reflects the last Progress value chosen by a staff member to indicate its progress towards completion (or a number of system supplied statuses like “Client entered”, “Staff entered” “Allocated”, “Updated by staff”, “Referred to third party”, and many more that indicate progress of the question from entry through to completion).
If a question is retired, “(retired)” will appear after the Status. Retired questions do not appear in Search results unless specifically selected to do so in the Advanced search screen.
*Parent/child questions – the question number of any questions that were used to create this question (Parent), or any questions that were created from this question (Child). These question numbers are hyperlinked to provide easy access to the Parent and Child questions.
*Time used/costs – the current cumulative total of time and/or costs accumulated in regard to this question (if the Time type and/or Cost type code tables are enabled so that these concepts are in use).
If more than one currency is enabled and all costs in relation to this question are in one currency, the relevant currency code will display in front of the costs. If costs have been recorded in more than one currency, they cannot be totaled and so the costs figure will be represented as “-.-“.
If this is a primary question with sub tasks or child questions, the totals showing here will appear like this:
c (a + b) where
a is the total time or cost for the primary question,
b is the total time or costs for all sub tasks or client questions to this primary question, and
c is the total of a and b, being the total time or cost for all of the work done in relation to this primary question and its subtasks/child questions – you may need to invoice this total amount!
For example:

If you use the optional payment functions (enabled by enabling the Payment type code table), the “Cost” summary showing in the Details screen will be the “Balance owing”. It appears in red when payments are in use to indicate that it is the total of costs minus any payments, and that it needs to be paid. Here’s an example of a request, with sub tasks, where the Cost is indicated in red because it is a balance of costs less payment i.e. Balance owing:

*Sub tasks – if the request has any links to other requests/tasks they will appear here. You can click on these request numbers to go to that linked request/task, or click on the label “Sub tasks” to see a summary of the status of all sub tasks for that request. If a linked request or sub task is already closed then its question number will not be coloured, making it easy to tell when these other tasks have been completed, and your question is ready to work on again! Also, cursoring over the question number of the linked request/task shows a tooltip that summaries the status of that linked request/task (it is generated using the QuestionDetail text template).
*Target date – the date by which this question should be completed (responded to). According to Parameter 2.12 this can be calculated as, the Objective response date, the Last useful date, or the earlier of these two. Target date is recalculated each time Objective response date or Last useful date is changed, or, if the question is reopened which automatically recalculates the Objective response date which could reset the target date.
*Received date – date and time that the question arrived in your organisation – normally the date and time it was entered into RefTracker unless the Post date function was used to enter a different value. Note that a symbol indicating the priority of this question also appear to the right of this date (the Normal symbol is blank so a priority symbol may not always appear in this location. If the label for this piece of data says “Open date” this question was reopened on the date shown.
*Last updated – date and time that this question was last updated by anyone.
*Objective response date – the date and time by which this question should be answered as calculated by adding the objective response time defined in the Request form used to enter the question, to the Received date, and ensuring that the time is within the responsible staff location’s opening hours. Your library will have chosen for either Objective response date or Last useful date to be the date by which questions of this type need to be answered (Target response date). If Objective response date is the Target response date for this question, this date will be followed by a red asterisk that has a tool tip indicating that is designates the Target response date.
*Last useful date – any Last useful date provided by the client. Your library will have chosen for either Objective response date or Last useful date to be the date by which questions of this type need to be answered (Target response date). If Last useful date is the Target response date for this question, this date will be followed by a red asterisk that has a tool tip indicating that is designates the Target response date.
*Date closed – the date on which this question was closed, if it has been closed.
*KB status – Excluded if not in the KB, Included (and the date it was include) if in the KB.
If Included the word “Included” will be hyperlinked to a page that displays the KB entry details including links to any attachments referred to in it. The URL of this page, is a permanent URL that can be used to refer clients to this KB entry and its attachments by simply cutting and pasting the URL.
*KB review – If this question is included in the KB, the date by which this question needs to be reviewed for continued relevance to the KB.
*FAQ status – Excluded if not in the FAQ subset of the KB, Included <date included) if in the FAQ subset of the KB. This will not display if your System administrator has configured the FAQ functions out of your system.
Question data: information about the question as collected in the Request form used to enter this question, including Received via, the Question text, any Question attachments, and any other information that was provided when the question was submitted e.g. Places already looked.
“Retire status” indicates whether a question has been retired, or not. Retired questions do not appear in Search results unless specifically selected to do so in the Advanced search screen. It is set by the Retire questions batch process.
Question attachments will show as a permanent link that can be reused by right clicking and using the Copy link option to save the URL for pasting anywhere else it might be useful.
Client data: information about the client who asked the question, as collected in the Request form used to enter this question, including their contact details, preferred contact method, and details of their question.
This area will also contain information automatically collected from the client’s browser, if the question was entered using the client interface – IP, device type, browser details and URL of the page from which the form was selected (if the client accessed the form from a link in a web page that was not a RefTracker client interface page). The browser user agent information is referred to http://www.useragentstring.com to obtain the browser details. To test the browser information being detected for any device, bring up the RefTracker staff interface and go to System>Utilities>Diagnostic tools>Browser details.
Locale and Language are also determined from the client’s browser and saved for each question. Locale only displays if this field is specifically enabled in the Data Dictionary. Language only displays if more than one Language is enabled in your RefTracker system and the Language field is specifically enabled in the Data Dictionary. You may want to enable these to fields if your systems services clients in different countries as they are saved for each question and used to ensure that follow-up correspondence with the client can be provided in the right language and using the right date formatting. Locale is determined from the LCID of the client’s web browser or from the language tags in the header of the email, if the question arrives by email. If a locale cannot be determined from either of these the locale will be set to the locale of your RefTracker system as defined for the client’s language in the System>Language code table.
When a question is entered by staff on behalf of the client the Locale (preferred date format and language) is set to that of the staff member entering the question (on the presumption that they are most probably in the same Country and using the same language).
If Locale is enabled it can be changed using the Change screen, if it is not set correctly for this client’s request.
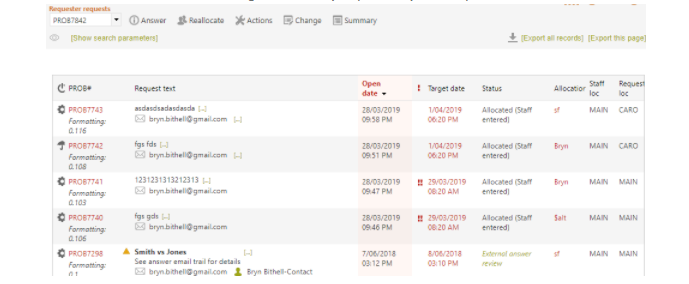
Client’s x total questions: This link appears if there are other questions in the system from this same email address (this option is not offered if the question does not have any email addresses recorded for it). The number x indicates the number of questions that have this email address in the client email field (the result includes questions where the email address field also includes other email addresses), since your organisation started using RefTracker. Note that this function shows all questions in the system from this email address, whereas, what the client sees is just the questions submitted in the period your System Administrator has allowed them to view as specified in parameter 6.10. In other words, staff see the client’s entire question history but clients only see recent ones.
Clicking on this link shows a summary of all of the questions submitted by this email address (both open and closed), in a separate window.
It is a normal staff search results screen so you can do all of the things that you can do in any other search results screen, in this sub window, such as looking at the history of previously asked questions. On initial display this screen contracts the search parameters. Use [Show parameters] to show the parameters if you need to change them.
Client options: This link appears for all questions where an email address has been provided. It goes to the Client interface “Manage this question” screen so that staff can make changes to the question on behalf of the client (such as Deleting the client contact details, or moving information received as a question update, to the Evaluation comments field when that is appropriate). It is also useful for staff who want to talk to the client about what they are seeing or trying to do in the client interface.
You need to be aware that anything that you record using this link will be able to be seen by the client if they look at their question History, and will automatically generate the same emails to the client that would have been generated if the client did the action themselves.
You also need to be aware that anything you do using this function is clearly noted as having been done by you, not the client, so your Administrator will quickly catch up with you if you try to use it to enter fictional client evaluations.
Bibliographic data: information about any bibliographic data stored in relation to this question. The labels used and the order of presentation are those set in the Request form used by this question.
ILL data: information about any ILL data stored in relation to this question. The labels used and the order of presentation are those set in the Request form used by this question.
Answer data: information about the answer including its text and any attachments, any Expertise value saved, and any Categories associated with the question. This section will not appear if no Answer data has been recorded yet.
Answer attachments will show as a permanent link that can be reused by right clicking and using the Copy link option to save the URL for pasting anywhere else it might be useful.
If this user has permission to see client evaluations, the evaluation rating and any evaluation comment will also show in this section. Those who can see evaluations will see “None” has been recorded in the Evaluation rating field if evaluation is allowed by this form but no evaluation information has been recorded for this question.
Exercise:
Familiarise yourself with the information provided by this screen.
If “I’ll respond now” buttons are showing, notice that the question is currently not allocated to anyone (shown in the Status section of this screen). Also notice that the question number is in the question action bar which means that you can now use any of the functions provided in that bar.
However if you want to start working on the question you can simply click on “I’ll respond now” – notice that it takes you to the Answer screen, and from the header bar in that screen you can see that the question has been allocated to you as a result of having used that function. Now go back to the Summary screen and you will see that even though you have done nothing else, the question is now showing as allocated to you.
Then click on the Correspondence tab in the Summary screen, so that we can examine the Correspondence tab.
The Correspondence tab
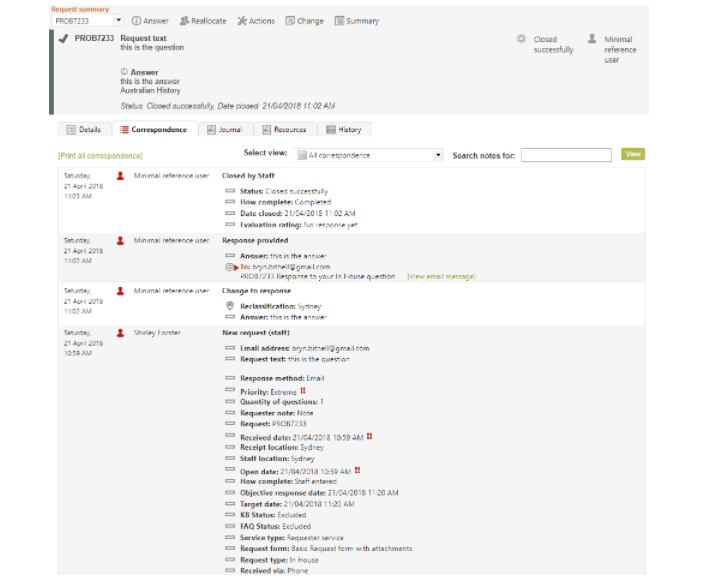
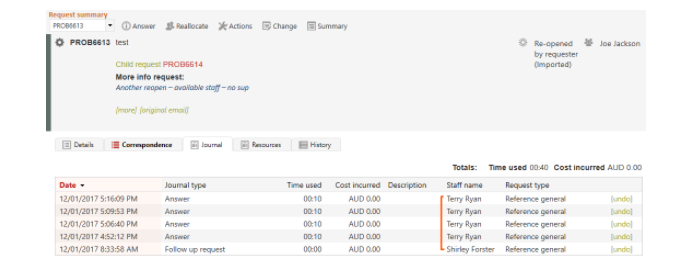
The Correspondence tab provides a summary of the correspondence events that have happened in relation to this question. It is the place that you go to when you want to view how this question has progressed over time, with an emphasis on the correspondence between the parties involved. The information in this screen is a subset of the information provided by the History tab.
If the last action done on that question was not done by the currently signed on user, the label on the Correspondence tab will include an exclamation mark icon – this ensures that work by other staff, and updates by clients, is noticed at the time of working on the question.

If the exclamation mark icon is showing you will be initially presented with the “All correspondence” view of the Correspondence tab so you can be sure to see all of the actions that have been done by others. If the Exclamation icon is not showing you will be initially presented with the Correspondence tab view that you last selected (the All client correspondence, for example) as this is likely to be the view that you most often use.
The screen is laid out in three parts – the view controls, the correspondence trail as determined by the view controls, and page controls.
The View controls at the top of this screen provide the option to view All correspondence, or just a subset of it, and to limit the events showing to just those events containing specified text in their notes.
The default view is All correspondence.
To see another view (such as just correspondence back and forth with the client), select a different value from “Select view” (e.g. “All Client correspondence”) and the view will change.
Entering a value in “Search notes for” then clicking View, will limit the results to events within that view that contain the text that you specify.
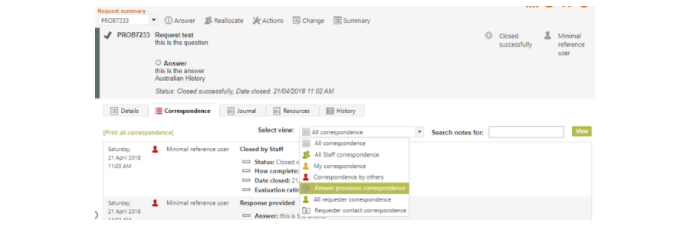
The Select view options are:
All correspondence – all correspondence events for this question.
All staff correspondence – all correspondence generated by staff for this question.
My correspondence – all (staff) correspondence generated by the signed on user for this question.
Correspondence by others– all (staff) correspondence generated by staff other that the signed on user for this question.
Answer processes correspondence – all correspondence events created using the Answer processes provided by the Workflows in the Answer screen (such as Note and Search criteria).
All client correspondence – all correspondence, to and from the client in relation to this question such as the question arriving, Query to client and the client’s response to the query. Clients are also given the opportunity to see a version of this view, from the emails sent to them and from the client interface “Check on existing” question function, so that they can refer back to past correspondence in relation to this question.
Client contact correspondence – all correspondence events created using the Client contact processes provided by the Workflows in the Answer screen (such as Query to client and Inform client).
The system remembers the view that you last selected for questions that use the same request form as this question. When you first select the Correspondence tab it will present you with the remembered View. If you select “All Client correspondence”, for example, the system will remember that you used it last and present “All Client correspondence” next time you view a question that uses that Request form.
However, if your question has been worked on by another party (as indicated by the exclamation mark in the Correspondence tab), the All correspondence view will display so you can be sure to see the updated information provided by the other party. The Exclamation mark icon will continue to appear if you change to a different Correspondence view that also includes the new action by the other party.
The Correspondence trail view area presents information for each event that has occurred in relation to that question, as applicable to the View you have selected, in the following format:
Date and time that the correspondence was recorded – entries are shown with the newest at the top of the screen, however where a client responds to a staff member’s Query to client, their response is always displayed as part of the Query to client event, no matter when their response arrived.
Author of the action – the name of the staff member or client who made the comment or performed the action. The icon preceding the name indicates whether the person was a staff member –  me or
me or  another staff member – or a
  client. If no name has been recorded for the client, the text “Client” appears in this column for events generated by the client.
Description of the action that occurred. There are a number of actions that can occur. Each action is presented in a row of the table with a Descriptive name followed by any number of attributes of the question that were changed by the action, followed by any emails that were associated with the action and a link to allow those emails to be viewed. The type of each attribute/email is clearly indicated by a symbol and that is followed by the text/values associated with that recorded change. There are many different types of records associated with an action with each being indicated by an icon with a appropriate mouse over text, such as the following:
 Any text associated with the action. Note that for query to client correspondence the Query to the client and the response from the client, are displayed together, even though the response may have come in at a different time (the date and time the response arrived is noted).
 A field that was changed by this action – When a new question is recorded, all of the fields that are populated by the question creation process are recorded and displayed in the record of that event in this screen. The fields are presented in the order defined by the Request form used to enter the question, followed by the system created fields in the order defined by the Data dictionary. Change events record only the fields that were changed. See the Details screen for the current value of all fields stored in relation to this question
 Any item associated with the action
![]() Any attachment associated with the action. Attachments are hyperlinked and can be clicked to view, however if they have been deleted from the question, they are not hyperlinked and can no longer be viewed.
Any attachment associated with the action. Attachments are hyperlinked and can be clicked to view, however if they have been deleted from the question, they are not hyperlinked and can no longer be viewed.

 Any incoming email associated with the action, the email address from which it came, and a View email message link to allow that complete email to be viewed.

 Any outgoing email associated with the action, its subject line, the email address to which it was sent (the text displaying in this event is the variable information that was sent in this email and so this display provides a verification of the email sent) , and a View email message link to allow that complete email to be viewed.

Any third party email in relation to this action, the email address associated with that action, and a View email message link to allow that complete email to be viewed.
 Any email between staff in relation to this action (e.g. reallocation), the email address to which it was sent, and a View email message link to allow that complete email to be viewed.
If the display goes over more than one page, page controls are provided at the bottom of the page. Arrows can be clicked to go back or forward one page, or to the first or last page, and individual page numbers can be clicked.The Page size control allows control of the number of to be displayed on a single page. To show more or less events per page, change the default value (20 in the example below) in the Page size box to another number and then click Change. This is particularly helpful if you want to print the entire History! Beware – the system remembers your favourite page size, and will use that value next time you display this page!

The View email message link
If an email has been sent in the course of this correspondence it can be viewed by clicking on the [View email message] link provided. You will be shown a message header containing the normal email message information such as when the email message was sent (or arrived), to: from: and any cc:’s, followed by the Subject, any attachments, and then the body of the email received or sent.
A [more] symbol at the end of the header information can be clicked to see the detailed header information.
The priority with which an email is sent or received is shown in this area – it will say X-Priority: 1 for High, 3 for Normal, and 5 for Low.
Any attachments to the email will display below the header information, and can be clicked to be viewed. QST attachments are sent as traditional attachments as are any attachments that came in with the original imported email (no matter what size these attachments are).
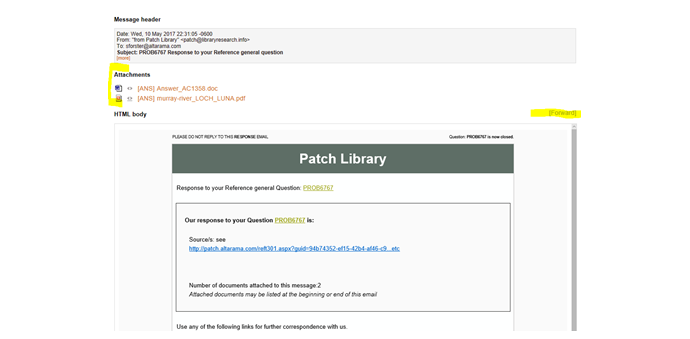
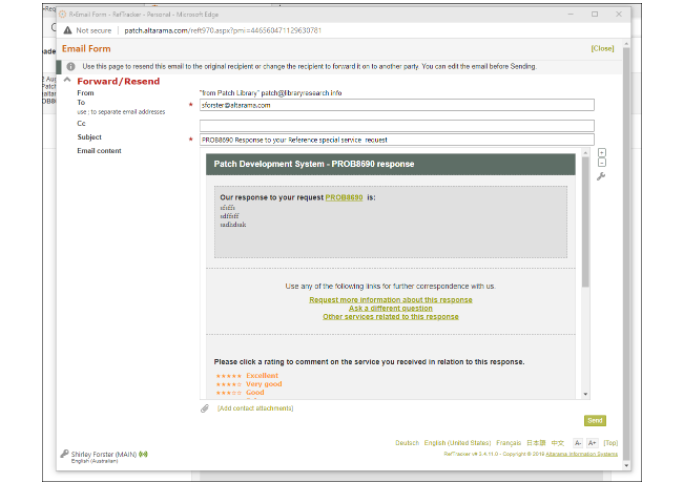
The [Forward] option in the top right of the [View email message] screen (see example in screen print above), allows the operator to resend any previously sent, or received, email and its attachments, or forward it on to someone else.
When an email is forwarded in this way a note showing who it was resent to, and a copy of the email sent, is included in the History of that question. This history note is an important audit trail for customers handling confidential information.
Use this [Forward] function to easily resend this email, as the To: and cc: addresses default to the original addresses, or you can change the To: and/or cc: information to send it on to other party/ies. RefTracker automatically removes alias information and any email address/es that are monitored by RefTracker (to prevent infinite loops) from the To/cc/bcc lines.
You can even amend the subject line, add and remove attachments, and add or remove information in the body of the email, before it is sent.
Here’s an example of the screen that displays so you can make any required changes before sending. This screen opens in a subwindow, and when you click Send, the subindow closes to indicate that the email has been sent.
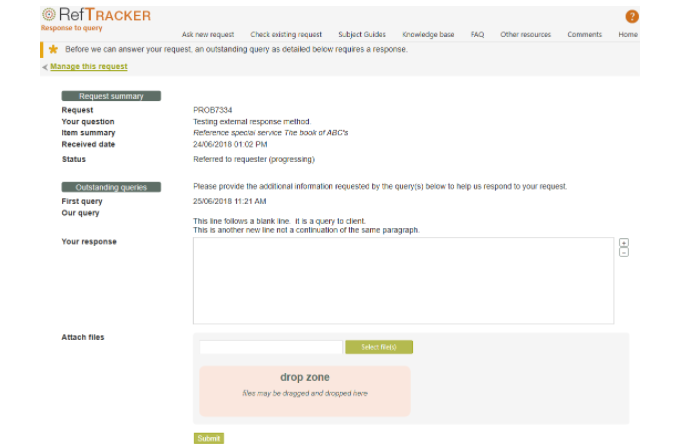
Links to send a Query to client reminder, and enter a Query response
System administrators can set up to have reminders sent automatically if a client has not responded to a Query to client within a specified time, and, optionally, for the question to be automatically closed if they do not respond to the reminder within a specified time.
Some customers may prefer to have staff decide when reminders should be sent in relation to questions where the client has failed to respond to a Query to client, so, whether or not the automated “Failed to respond” process is set up, staff can send manual “Failed to respond” reminder notices whenever they think they are necessary.
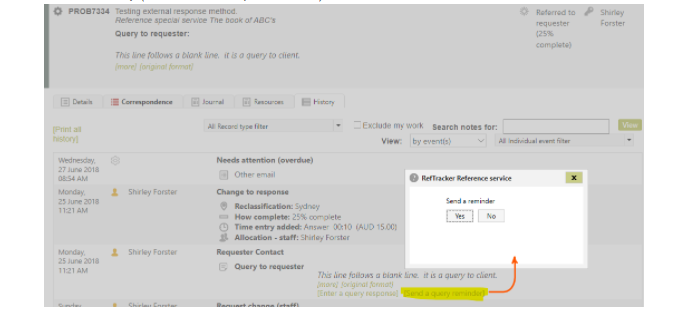
There are two places where staff can manually send a reminder (or enter the client’s response on their behalf) – in the Answer screen and in the Correspondence/History tab of the Summary screen. Here’s how to use it in the Correspondence and History tabs of the Details screen.
Go to the Correspondence or History for the appropriate question, and if a Query to client has not been responded to using the link in the Query to client email, and, if a reminder has not already been sent (manually, or by the background process, if that is running in your system), a [Send a reminder] link will be showing below the record of the Query to client.
You will see that there are two options provided at this point –
– “Enter a query response” that allows you to enter a response to the query on behalf of the client. When you click “Enter a query response” the client interface screen that the client could have used to enter a response to that query shows, and you can enter the response, as if you were the client, using the client interface function that they would have used.
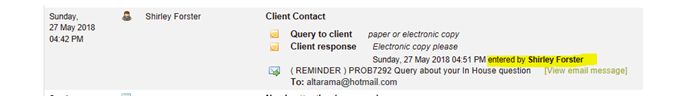
When you submit the client’s response in this screen, a confirmation screen displays, as it would for the client. Close the tab showing the confirmation and you will be taken back to the staff interface ready to do more work on that question (or any other). If you go to the History tab, or refresh it if it is already showing, you will see that the history now records the query and its corresponding response in BOTH the history entry for the original query and the history entry for the reminder. Importantly the fact that it was a staff member who entered the response is clearly shown by the ”entered by” information.
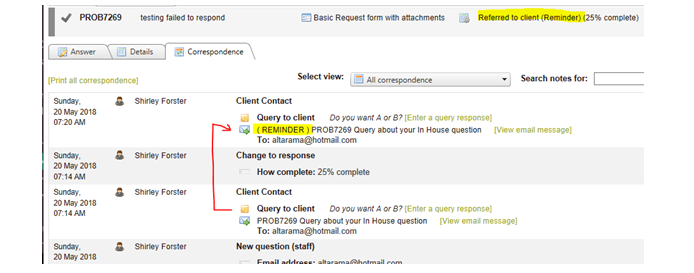
– “Send a query reminder” that allows you to send a query reminder immediately. Click the [Send a query reminder] link and click “Yes” in the confirmation box when it displays, to send out a reminder.
But before you send the reminder, be sure to check any newer History entries that might show that a response has arrived in another way (such as via an imported email).
A “Reminder email has been sent” pop up message then displays and when you acknowledge that message, the History screen redisplays with a reminder history record showing at the top. The [Send a query reminder] link no longer shows in either the original history entry, or this new reminder entry, as the reminder has now been sent.
The Correspondence and History tab’s Print link
In the History and Correspondence screens there is a “Print” function designed to allow the question’s audit trail to be shared (such as for justifying the work done, or to send a summary of it to your Records Management System). In the History screen it is called Print all history, and in the Correspondence screen it is called Print all correspondence. If you have selected a subset of the history or correspondence two links will appear – [Print all], and [Print this selection]
Click the appropriate link and a summary of the question and answer, if there is one, followed by the audit trail you were viewing, displays.
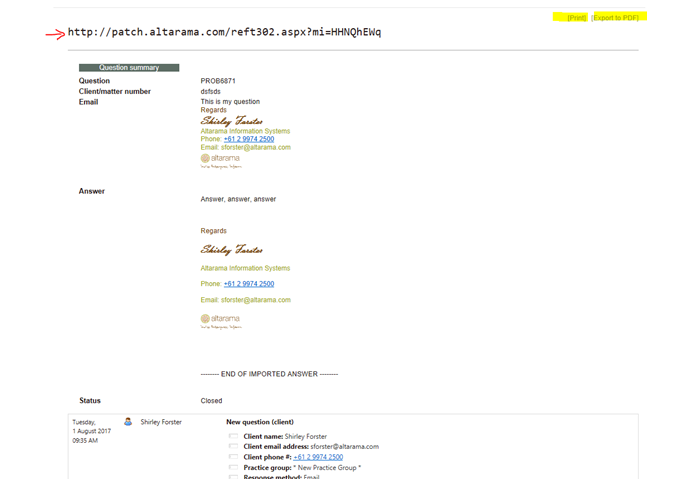
From this display screen you can:
– [Print] the whole screen or a selected number of pages of it using your browser’s Print function. Hyperlinks and [more] symbols will not be clickable once printed.
– Copy the URL that shows at the top of the screen and share that URL with others who can then, not only see the contents of the screen, but can also take advantage of the hyperlinks in that screen.
– Use your browser’s share function to send this summary of the audit trail information to an email recipient. Hyperlinks and [more] symbols will not be clickable once emailed, but the URL at the top of the page will provide access to a version with clickable links.
– Copy and paste the content into another system such as WP to create a version that can be edited and saved. You may want to first expand any [more] symbols showing to ensure the full text is copied.
– [Export to PDF] displays a version of the history/correspondence that is specially designed for PDF. The pdf includes a permanent link (Parameter 0.34 controls how long it remains a valid link) that allows the page to be viewed online so the user of the pdf can take full advantage of all of the features of the History/Correspondence screen. In the pdf, the hyperlinks are clickable, but only the start of each text field (how much is controlled by parameter 3.8) displays followed by . . . to indicate that there is more (that can be seen by using the URL for the fully functional history/correspondence page provided at the top of the pdf).
Implementation hint: System administrators may want to review the setting of parameter 3.8 that controls how many lines/paragraphs of the text fields will display in these print functions, before the [more] symbol will appear in the “Print” screens, and the . . . . characters will appear in the “Print” pdf. Users of this output will want it to show enough of the Question and Answer and other text used in developing this answer, to immediately recognize what it is about. You may want to increase the default value of 10 lines/paragraphs if the text of your questions and answers is generally longer.
System administrators should also review Parameter 0.34 “Printable view link retention”. If you are sending these “prints” to your Records Management System, for example, you may want the URL that appears at the top of this output to remain active for the amount of time for which your records need to be kept so that the complete text can be viewed. Default value for how long this link remains active is 6 months.
The Journal tab
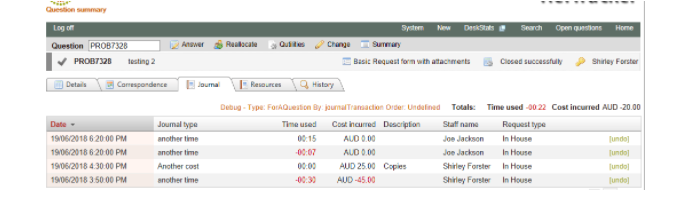
The Journal tab provides a summary of the time and costs logged against this question while using RefTracker response screens, including the Record time and Costs screens. It provides the same information that shows at the bottom of the Record time and Costs screen, and only appears if your System administrator has chosen to allow recording of time and/or costs in your system, and allowed you to see this information. Negative values are adjustments (which can only be entered by Supervisors and System administrators) and are show in red.
Totals for the time and cost entries in this page display at the top right of the table. If more than one currency is enabled and all costs in relation to this question are in one currency, the relevant currency code will display in front of the costs. If costs have been recorded in more than one currency, they cannot be totaled and so the costs figure will be represented as “–.–“.
Your System administrator can also remove this function from particular users by disabling the “View journal history in summary page” function. If the Journal tab has been removed for a user, then that user will also not see any time or cost information in their History tab.
Some organisations just allow users to see the time and/or costs that they have entered themselves in this screen, and not time and/or costs entered by anyone else. System administrators do this by denying the View time (self) and/or View costs (self) functions to that user.
The table in this screen can be easily cut and pasted into WP or Excel (for invoicing, for example).
Click on any of the column headings to sort the information on this screen by that attribute. The arrow that appears in the column that has been used to determine sort order, indicates whether the sort order is ascending or descending.
System administrators can correct entries showing in this screen by entering negative values in the Record Time and/or Costs screens, or by using the [Undo] link that appears to the right of each entry in this screen (only for System administrators).
The Resources tab
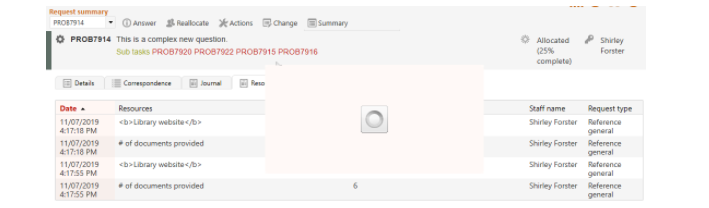
The Resources tab provides a summary of the Resources recorded in relation to the current question. The tab may have a different name if your organisation uses the Resources concept for a different purpose and has renamed the code table that controls this function. This tab will only display if the Request form used to record this question has Resources enabled.
The default display order for this screen is by date and time that the Resource was recorded as having been used (most recent at the top). However you can easily review the Resource usage by the Resource used, but clicking the Date column heading to remove the date sort order, and then clicking the Resource column heading to sort by Resource.
Your System administrator can remove this function from particular users by disabling the “View resources in summary page” function. Resources use is also recorded in the History tab. If the Resources tab has been removed for a user, then that user will also not see any time or cost information in their History tab.
The table in this screen can be easily cut and pasted into WP or Excel (for further analysis of numeric descriptions, for example).
Click on any of the column headings to sort the information on this screen by that attribute. The arrow that appears in the gray column/s that has been used to determine sort order, indicates whether the sort order is ascending or descending.
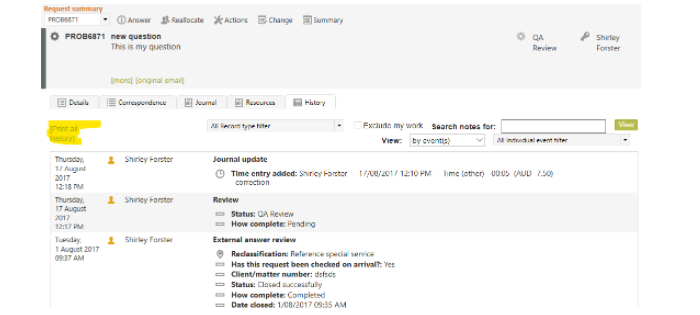
The History tab
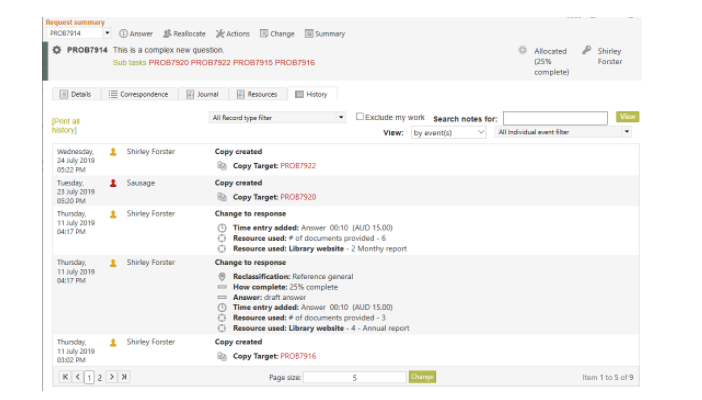
The History tab in the Summary screen brings up a screen in the format shown above. You can use this screen to see a full audit trail of every action that has been undertaken in relation to this question, whether it was done by a staff member or by the client or by the system. It also provides detailed tools for viewing just parts of the History.
This screen is particularly useful when a system or network failure has occurred. By reviewing the History tab you can tell just how far the system had progressed on the function you were doing at the time of the failure, allowing you to determine which parts of the function that were not completed as a result of the failure.
The Correspondence tab provides a subset of the information provided in the History tab, so the layout is similar.
All functions available in the Correspondence tab are available in the History tab (be sure to review them in the Correspondence section above), however, in addition, records for some system events that are not strictly correspondence, and records about information changes, are provided in the History tab:
 Time accumulated in relation to the event (except users without permission to view the Journal tab)
 Resource save in relation to this event
 The staff member allocated the question in this action
View controls at the top of this tab are designed to allow the user to see any subset of the historical events relating to this question. Untick the functions that you want to remove from the display. Tick function to add them back in (for example, you could select to see All emails in relation to just the Third party events). Don’t forget that the Correspondence tab provides a different view of a subset of the same information as the History screen.
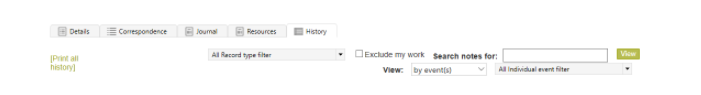
Selecting the View will change the available parameters.
- By event(s)/event group(s): allows you to select events by individual event or by ranges of similar events.
- Individual event filter/event group filter: allows you to select the individual event(s) or groups(s) of events that will show, for example, just the ILL events. Customers with parameter 2.20 Log question views can also choose to add display of the records of who has viewed this question by ticking “Views”
- Record type filter: allows you to select the types of actions within each event that will display e.g. just the emails, or just the changes in attachments.
Ticking “Exclude my work” limits the view to just work done by the client and staff other than the signed on user.
A Search function is also provided that returns events in your View containing your search word/s in the notes associated with them.
The Page size control allows more records to be displayed on a single page, and other pages to be viewed. Click the number of the page you want to view or the arrows to move between pages. To show more or less events per page, change the default Page size value (20 in the example below) to another number and then click Change. This is particularly helpful if you want to print the entire History! Beware – the system remembers your favourite page size, and will use that value next time you display this page!

Print all History provides options to allow the information showing in this screen to be shared, such as for justifying the work done, or to send a summary of it to your Records Management System. You can use this function to Print the History, create a pdf version of it, copy the URL of this page so others can view it, copy and paste the screen content to another product like WP, and even use your browser’s Share function to email this information to someone.
For details of how to use this function see the information provided about it under the Correspondence tab heading above.
Exercise
Familiarise yourself with the History tab for the question that you have been working on. Start at the end of the last page of the display and follow each entry. You will soon see how it reflects everything that any staff member, and the client, and the system, have changed or caused to occur in relation to this question throughout this manual.
When you are familiar with the full event History, try selecting some of the other Views to familiarise yourself with how they can be used to find selected History events. When you are familiar with this screen go the next section.