Data extract for full Questions (Display)
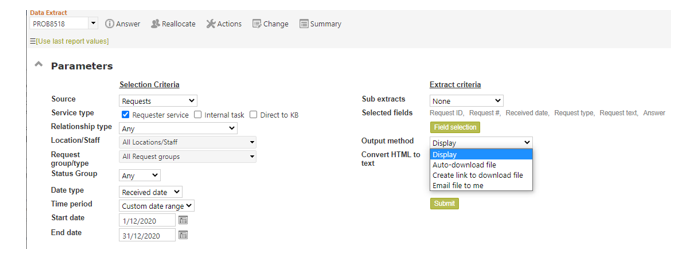
Now let’s look at the data provided by the Data extract report for full questions. The above screen was created by simply changing the Source to “Questions”, and setting Output type back to “Display”.
The Question number in this report is hyperlinked to the Details screen of that question in RefTracker so it is easy for you to make adjustments to questions as a result of viewing this information.
Options are available to:
- create sub reports by Location, Staff member, or Service type
- To output to a file, create a link to view the output file, or email the file to yourself
- To include any HTML in the report, or not. When Source is questions, fields like Question and Answer can include HTML. Some outputs such as Display and Excel can format the HTML, but others like CSV will display the HTML code rather than formatting it. Further, HTML formatted output can take more room than standard text and that may also be a reason why you may want your Data extract output in text format rather than HTML. If you are exporting the data for use in another HTML compliant system you may want to include the HTML and so leave the new “Convert HTML to text” reporting parameter unticked, but if you want a human readable output you may prefer to tick the “Convert HTML to text” parameter. It’s now your choice!
Be careful when selecting the parameters for this report. It reports questions by the allocated staff member and the allocated staff member’s location.
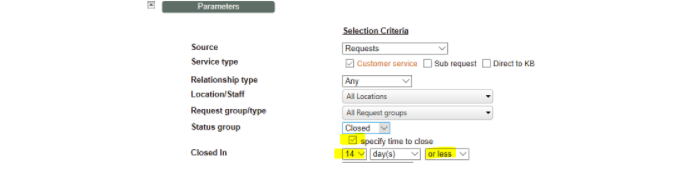
This report will list all of the details of all of the questions that match the search criteria. You can use the Service, type, Relationship type, Location/Staff, Request group/type and Status group parameters to restrict the records returned by this report. For example, if you want to know the details of all the questions that took more than 14 days to respond to for your location only; choose the Location, Status group Closed with “Specify time to close” set to 14 days or more, and Date type “Closed”.
Date type is Closed date by default as it is the most sensible choice when you want to know the staff/resources used in developing answers, but Received date is sensible for measuring incoming workload. Journal activity is used when you want to look at the questions worked on during the selected period measure. This “Data extract” report is reporting on total time spent on that question (no matter when it was spent) for the received and closed date options, but just the time used in the selected period for the Journal activity option. If you want a summary of what your staff have done during during this period, you can also use “Journal reporting” report. The “Evaluation date” option only returns question for which an evaluation has been received during the selected period.
Note the “Selected fields” option appears allowing you to select the fields that will appear in your Extract and the order in which you want them to appear.
See the Reporting – Data extract page for details of how to use the Field selection button to select and order the fields/columns that you want. The Flied selection options provides tabs for each data table and select all buttons to make it easy to select the whole table. Or you can just select the specific fields that you want from each table.
Note that the ability to extract Client fields is limited to System administrators only as this data needs to be treated with the utmost security.
Also note that some .csv compliant reporting products have problems dealing with more than 250 characters and RefTracker text fields can be up to 2 Million characters in size, so you may need to take care in including text fields that might include large amounts of data.
Where the amount of text in the Question and Answer field is large, the [more] function is used in Display mode to limit the amount of text that displays initially. Just click the [more] link to see the entire text. [more] is not used in the Excel, CSV and XML output formats as the link would not be clickable in these formats.
When you select to include Resources array in your output, an additional column will be added to the output for each enabled Resource that you have defined in your system (and any enabled ones for which stats were recorded in your selected period). The date on which the resource usage was recorded appears in the column, and, if any Resource comment was recorded it is also displayed in the column with a “~” separating the date and comment. If the Resource was used more than once, information about each usage is separated by “|”. If you need to report on the individual Resources used, use the Resource usage analysis report so you can select to include the Resources list field.
When you select to include Categories array in your output, an additional column will be added to the output for each enabled Category that you have defined in your system (and any enabled ones for which stats were recorded in your selected period). A “Y” will appear in the column of each Category that has been applied to that question.
The Service type column is used to indicate whether a question constituted the delivery of a service or not. It can have the following values:
Client service = a question entered in full using the New screen, or that came in through the client interface, or a Quick question saved as “Allocate to me and save”, or a Quick question saved as “Close and save”. It can also be a question that was copied to create another service for the client.
Internal task = a question that was created to handle a task not resulting in delivery of a service to a client – such as a survey, or a sub question created to allow multiple staff to work on different parts of a question.
Direct to KB = A question saved using “KBnew”. The reason that “KBnew” is distinguished in this way is because they are questions saved directly to the knowledge base. As such they are KB maintenance functions and not service delivery functions. The RefTracker statistics provided by the RefTracker Statistical reporting screen, ONLY include this type of question if you specifically tick the “Direct to KB” box in the Question type parameter line because Statistics reports should indicate the quantity of client service provided (which means that these KB maintenance questions should not be included).
The Time used column reports the total time used by staff in responding to this question to date, in minutes. It is not the time spend during the selected period unless you select the Journal activity option at Date type! In the Excel output this and another numeric only fields are totaled at the end of the data.
The Cost incurred column reports the total costs attributed to this question to date. Costs are accumulated by multiplying time used by the billing rate of the staff member performing the action, or by adding specifically incurred costs using Records costs.
Only when the report includes Primary questions with sub tasks or child questions, separate columns will be provided for Time used (subs) and Costs (subs). These are time/costs incurred in relation to sub tasks or child questions that were related to the reported question and are required for billing the entire cost of that Primary request.
The Minutes to close column shows the number of minutes from arrival of the question to when it was closed. A zero in this column means the question was closed on the spot, or is not yet closed, or has been reopened and is not yet re-closed. Other numbers are calculated as minutes from Received date to date closed, or, if the request has been reopened, minutes from Reopened date to Data closed. Divide by 60 to get hours. Divide by 1440 to get days.
Note that the value in this column is time from arrival to time closed “as seen by the client”. It is not adjusted for weekends or public holidays or for any times that your organisation was closed. You can report on this figure using the “Specify time to close” parameter that appears when you Choose questions with Closed status, in the Statistical reporting screen. You can even use this parameter option to limit the requests included in this Data extract report to just those closed before or after a certain amount of time from their receipt.
Where a question has been reopened, the report is based on the Reopened date to the final close date because this is the time that the client sees your responsiveness, but it does mean that if the client can reopen the question with a “thank you”, this will decrease the total time to respond. For this reason we recommend that you review the Edit options setup of your Request forms and implement the Client evaluation function, if it is not already in use (as when clients use the evaluation function, the question is not reopened and so better statistics are provided) We also recommend that you consider preventing clients from reopening questions where appropriate. Further we recommend that, for each request form, you set the “Allow reopen by client” option to “As a request” so that questions are ONLY reopened when a staff member approves the reopen.
The Relationship type column reports the relationship that this question has to any other question:
Individual means there is no relationship to any other questions.
Primary, Parent or Linked from means that there will a question number or numbers in the “Linked requests” column for the associated questions.
Child, Sub task, or Linked to means that there will a question number in the “Primary request” column for the associated Primary question.
The Primary request column reports the question number for any associated Primary, Parent or Linked from request. The question number will be hyperlinked to the Details tab for that question.
The Linked requests column reports the question numbers for all ASSOCIATED subsidiary Child, Sub task, or Linked to questions (the Relationship type column tells you what type of linked question it is). The question number/s will be hyperlinked to the Details tab for the appropriate question when displayed, but when shown in Excel, only single question numbers can be hyperlinked.
The Request attachments and Answer attachments columns provide URL’s for any attachments. They are clickable when displayed, but not clickable in Excel (copy and paste them into a browser to view from Excel).
Saved Exports
When you have successfully run a report, he system will offer “Create saved extract”, that allows you to save the parameters you are using so that they can be rerun with just a couple of clicks for the System>Reporting>Data Extract menu, and the report can even be scheduled to run automatically. See the Reporting – Data Extract help page for more details.