Reporting – Statistics reports
Statistics reports is a report writer where you determine the parameters that you want to report on, each time you use the screen (as opposed to Completion summaries, that produces a standard set of reports; and Data extract that takes entire request records out for external analysis). You can find it under Reporting in the main header bar, and at Reporting>Statistics reports>New statistics report, if this user has created any saved reports.
Statistics reports can even be saved for reuse with just a few clicks (see more information about this below), and scheduled to run automatically with output emailed to selected email address/es.
Because the data collected for Source Full questions and DeskStats is not identical, reporting options for Full questions and DeskStats separately, and Full questions and DeskStats together, are different. The parameters in this screen will automatically show the options available for the choices that you make for the various parameters in this screen, but be sure you know whether you want statistics for just Full questions, or just DeskStats, or both!
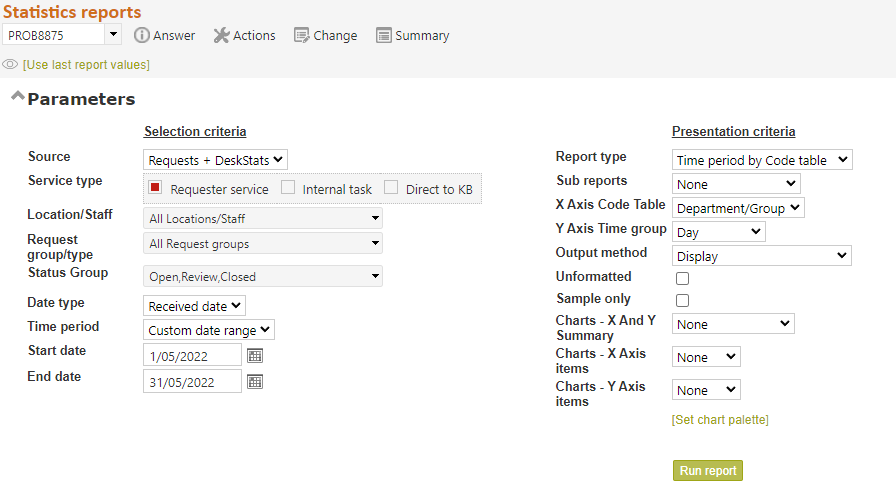
The parameters provided in this screen allow you to choose how the data to be reported on will be selected (in the left column), then the type of report that you want to produce, its X and Y co-ordinates (in the right column), and the type of output required (in the right column). X and Y co-ordinates are usually time period or code tables enabled in your RefTracker system. After the discussion of parameters that follows here, we will look at some examples of how these parameters are used. You will find particular parameters provide the reports that you need – save a screen print of the parameters that provide the results that you want so that you can replicate the same report on a regular basis, or create a a saved report.
Note that the system remembers the parameters that you used last time for each report. When you select a report, the default parameters for that report show, but you can easily select to use the same parameters that you used last time for that report, by clicking the [Use last report values] link in the top left corner. This makes rerunning favourite reports for different time periods very easy.
Not all parameters are applicable to all reports so some parameters cannot be saved – be sure to check your report parameters before clicking Submit!
It is important to think about the parameters you need for your report, to ensure that the data produced reflects what you need.
Selection criteria
Source: Choose the type of data that you want to report on.
- Choosing Questions will provide results about the questions that have been entered into RefTracker in full .
- Choosing DeskStats will provide results about the questions that have been answered in a single service, and so only recorded using DeskStats in either the online or batch mode.
- Choosing Questions and DeskStats will provide statistics for your entire reference operations – note that because the data collected for these two types of transactions is different, not all reports are available for the combined selection Questions and DeskStats .
System administrators (only) can also select Client data only in this option to obtain statistics about the clients using your system. The system contains one client record for every question in the system that included client data, but as some questions are collected without client data, the count of client results obtained from this screen will not match the full question count and should not be used as an indicator of volume. Use this Client data only option for obtaining client email addresses for purposes such as sending an email with a link to a follow-up survey, or perhaps for sending outbound marketing emails to your recent users.
After you make a choice of Source, the screen will redisplay with the parameters applicable to that choice.
The system remembers the choice you made here last time and presents that choice again next time (great for customers who only use full questions or only use DeskStats).
Service type: This line only appears for Questions, as it allows you to exclude (or include) those questions that were simply entered in order to populate the knowledge base, and to include/exclude Client service questions vs Internal tasks. By default Direct to KB questions and Internal tasks are excluded as they are not a direct service to your end users. To include these other types of requests, tick the appropriate tick box/es.
Questions are marked as Client service when the question is in relation to the provision of a service to the client (uses a Requester service type request form). This is marked as default in this screen as the most likely statistics you will want are in relation to the services that you have provided to clients.
Questions are marked as Internal task when the question is in relation to a task being one for a staff member, statistical collection only or a sub task e.g a Survey, or a sub question created to allow multiple staff to work on a question.
Questions are marked as Direct to KB if they were entered directly into the KB (as opposed to those in the KB that originated from a question from the client). This is KB maintenance rather than a service to the client.
Note that you might also need to select a Relationship type or Request type parameter to get the exact selection of question to report on, that you want.
There is also a Service type sub report that you might want to consider using, and you can also analyse by Service type by choosing it in the X or Y axis of a Code table report.
Relationship type: This line only appears for Source “Requests”, as it allows you to report separately on Parent and Child questions, Primary and Sub questions, and Linked requests. You will want to report separately on Parent and Child questions if your organisation copies questions for the sole purpose of creating sub-questions that should not be included in your statistics. Similarly you will want to report separately on Primary requests and Sub tasks if your organisation uses the Sub task functionality to allow multiple staff to work on different parts of a question, or different steps in a work flow.
Select Single requests (only questions with no dependencies),
or Parent/Primary (only questions with dependencies)
or Child/Sub (created by Linked using the parent/child relationship), and Sub task (created by Create a sub task) which are all dependent requests
or Link/s (created by the “Link requests” or “Create linked request” functions)
If you only want to report on Sub tasks choose just Internal tasks at Service type and Child/Sub tasks here.
If you tick Service type “Direct to KB” for this report, any Direct to KB requests will appear as “Individual” requests in this report.
Sub reports by Service type might also be helpful if you are interested in reports by relationship type.
Location/Staff: Often you only need to report on the statistics for one or more of your locations or staff members, but other times you may want statistics for all Locations, but broken up by each of your library Locations or Staff members. You can choose to report on more than one staff member or location by unticking All Locations and then clicking as many of the individual Locations or Staff members as you need.
Click the + or – icons to the left of the tree to open or close a branch of the display tree.
If you choose more than one item from the tree, they will be show in the box comma separated.
Choose a specific Location or staff member, or All locations/staff for a total of all of your Locations, or, if you need to report by EACH location or EACH staff member, indicate that at the separate “Sub reports” parameter in the right hand column. The Sub reports options provide separate reports for each of the selected staff or locations (as opposed to selections at Location/staff that will result in one report covering all of the selected locations or staff.
IMPORTANTLY, all of these reports report by the Staff member currently allocated the question and the Location of that allocated Staff member.
Disabled staff appear in this list because questions closed by these staff will still be allocated to them, and can be found by searching by their name, from this list.
Request group/type: If you only need to report on the statistics for one or more of your request groups or types, but other times you may want statistics for all Request groups (and types), you can select one or more of these by unticking All Request groups and then clicking as many of the individual Request groups or types as you need.
Click the + or – icons to the left of the tree to open or close a branch of the display tree.
If you choose more than one item from the tree, they will be show in the box comma separated.
Status group: Select the status of the questions that you want to report on – Open, Closed, Review, Not a service, and Rejected. By default, only Open, Closed, and Review are selected, as Not a service and Rejected are not actually services provided to end users. You can select them when they are appropriate, and you can change this default setting if you want to consider these as services provided.
To change this default System Administrators should go to System>Code tables menu and in that screen choose the Status Group code table. In that code table, the Statistics default column controls which statistics should be included in statistics by default.
If you select just Closed status an additional Specify time to close tick box appears to allow you to report on questions closed within a selected period from their arrival (using the “or less” option), or, questions NOT closed within the selected period (“or more” option). The time period is measured from the Received date/time, to the Closed date/time, of each question – the time from request to response as seen by the client (includes weekends and public holidays). If you do not want to include weekends or public holidays, add that number of days to the period you select. For example, if you are reporting on questions closed within 5 working days and there was a public holiday and a weekend in your selected period, choose to report on 8 days instead of 5 days. However we would recommend that you consistently use the time seen by the client as your measure, rather than the number of working days, as the impact of public holidays will be different for questions closed during different parts of your reporting period.
Specify time to close: Tick this box to show the additional parameters required if you want to select questions by how long they took to close – it is used for reporting where your service objective is to have all questions closed within x days of their arrival. This additional parameter is available for all reports, even the Data extract report that will show you the details of the selected questions – great for management review of questions that took a long time to close!
Closed in: number of days from Receipt to Close as seen by the client
“Or less” returns questions closed in that period (so zero days would return all questions closed as they were entered only).
“Or more” returns questions that took more than that period to close (closed AFTER the selected period)
So, the questions reported by “Or less”, plus the questions reported by “Or more”, equals the total questions closed during your selected period.
This time period is measured from the Received date/time, to the Closed date/time, of each question – the time from request to response as seen by the client (includes weekends and public holidays). If you do not want to include weekends or public holidays, add that number of days to the period you select. For example, if you are reporting on questions closed within 5 working days and there was a public holiday and a weekend in your selected period, choose to report on 8 days instead of 5 days. However we would recommend that you consistently use the time seen by the client as your measure, rather than the number of working days, as the impact of public holidays will be different for questions closed during different parts of your reporting period.
Date type: Choose whether the Time period will refer to the date on which the question was received (Received date) or the date on which it was closed (Closed date), or any question worked on during the selected date period (Journal activity), or any question for which an evaluation was received (Evaluation date) during the selected date period. The Open date option reports on requests that were last opened or reopened during the selected time period (Note that this means that requests that arrived during that period but were reopened at some later date outside the selected date period, are not included in the Open date selection). So, “Received date” shows the number of newly arrived questions. “Open date” shows just the questions that were most recently received or reopened during that period. It does not provide all of the questions that were worked on during that period (try the Journal entry report for that).
Closed date is default as it is the most sensible choice when you want to know the cost of developing answers, but Received date is sensible for measuring incoming workload.
Journal activity is generally used when you want to look at the questions worked on during the selected period. Note that reports like “Time expended by code table” are reporting on total time spent on that question (no matter when it was spent) unless you specifically choose “Journal activity” here. The “Journal reporting” report, provides more ways to report on questions worked on during a selected period.
Event date is used when you want to look at questions for which historical events occurred during the selected period.
Note that these lines only appear for source Questions as by definition all DeskStats are received and closed on the same day.
Time period: Choose a standard time period such as Last week or Last month, or choose [custom date range] and then set a start and end date. Choosing a time period rather than specific start and end dates will allow your parameter selection to be run again in future without having to select new dates.
A week is usually defined as Sunday to Saturday but your system administrator can change this using Parameter 2.18.
A quarter is defined as the three month periods starting on 1 January, 1 April, 1 July and 1 October.
Calendar year and Financial year options are provided. The Financial year begins in the month specified by Parameter 2.19 (and is not offered if January is chosen here as that would be the same as Calendar year).
“All dates” should be used with caution. This is particularly useful for reporting on open requests, especially scheduled reporting on open requests, as open requests will have come in over a variable extended period of time. Using individual start and end dates will create a more efficient report, as “All dates” means examining the whole database.
Start and end date: If you choose a custom date range you will need to enter the starting and ending dates for which you want to report statistics. These dates are inclusive. The earliest date that you can chose is one(1) year before the date of the earliest Full question or DeskStat in your instance of RefTracker.
Presentation criteria
Report type: Depending on the Selection criteria that you have chosen, a selection of report types will be available. Choose the report type that suits your needs. The report types available are:
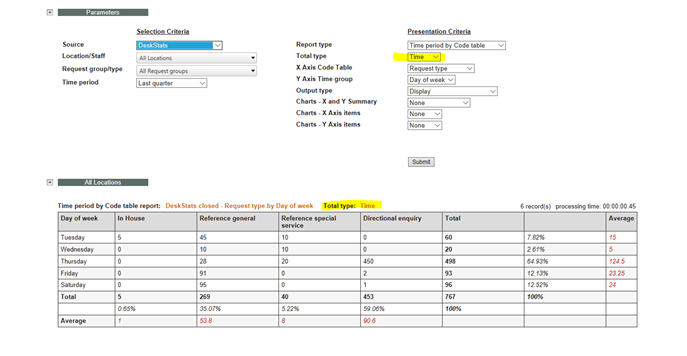
Time Period by code table : This report provides a quantitative summary report with X axis the code table that you choose, and Y axis the time period grouping that you choose in the parameters below. For example this report can show you how many of each request type arrived each day of your reporting period.
Time Period by time period : This report provides the ability to analyse transaction trends, for example, an analysis by hour and by day of the week, will show the number of transactions per hour for each day of the week – a handy measure for analysing required staffing levels.
Relationship by code table : In conjunction with the Relationship selection criteria (when appropriate), this report allows separate analysis by Individual requests (no dependencies), Parent, Child (created by Linked using parent/child relationship), Linked to, Linked from (created by Linked using Linked to/from relationship), Primary and Sub task (created by Create a sub task). This report will generally be used by organisations that copy questions to break up the work and so don’t want them included in their statistics.
Target date by code table : This report provides a quantitative summary report with X axis the code table that you choose in the parameters below, and Y axis whether the Target response date was met or missed. For example this report can show you how many questions were answered within their target response date, and how many were not, by staff member, throughout your reporting period.
Timeliness by code table : This report provides a more detailed report on timeliness of provision of responses than the Target date by Code table report. It summarises the timeliness with which questions are closed, by
. Original target date met – which means that the response was provided within the target response date, and the target date was not ever adjusted
. Original target date missed – which means that the response was NOT provided within the target response date, and the target date was not ever adjusted
. Revised target date met – which means that the response was provided within a target date that was adjusted at some time during the life of the question
. Revised target date missed – which means that the response was NOT provided within a target date that was adjusted at some time during the life of the question.
Time expended by code table : This report provides a quantitative summary report with X axis the code table that you choose in the parameters below, and Y axis the librarian time used in answering the questions for the time period you have selected. For example this report can show you the amount of staff time spent, by the organisational divisions of the clients who asked the questions, for the period you have chosen to report on. It can be used in conjunction with the Relationship type parameter to separately report on time expended by Individual requests (no dependencies), Parent, Child (created by Linked using parent/child relationship), Linked to, Linked from (created by Linked using Linked to/from relationship), Primary and Sub task (created by Create a sub task).
Cost by code table : This report provides a quantitative summary report with X axis the code table that you choose in the parameters below, and Y axis the costs attributed to questions answered in the time period you have selected. For example this report can show you the cost of library time and other expenses, by the organisational divisions of the clients who asked the questions, for the period you have chosen to report on.
Code table by code table : This report provides a quantitative summary report with X axis the code table that you choose in the X axis parameter below, and Y axis the code table that you choose in the Y axis parameter below. For example this report can give you an analysis of the number of questions of each type that were handled for each of the organisational divisions of the clients who asked the questions, for the period you have chosen to report on.
Data extract : These reports show the information recorded about the questions that comply with the selection criteria you have specified. The Data extract option is only accessible by systems administrators, for security reasons. When Data extract is selected:
- for DeskStats the complete record will be made available, or
- for full questions, the non text information in the Question table of the Data dictionary is provided, plus the Total time, and Total cost fields from the Journal table of the Data Dictionary. To this base amount of information you can add more information using the Include fields option that shows when you select Data extract (see below for details of the include fields options).
Sub reports: You ONLY need to set this parameter if you want to have reports for EACH individual staff member or EACH individual location, or EACH individual Service type that you select. These “each” functions provide a separate report for each location/staff member/service type plus a total for all locations/staff members/service types (as opposed to the selections that you make at Location/staff/Service type that result in one report covering all of the Locations/staff/service types that you choose).
If you choose the Export (Excel spreadsheet) output option, with this sub reports parameter, the report for each location/staff member/service type (and the total for all location/Staff/Service types) will each be in a separate tab of the spreadsheet, and if you choose the .csv or .xml options the results will be in separate files.
The Sub reports option is not applicable to the “Requester data only’ Source option and is not provided for that Source option.
Total type: RefTracker can report by a count of the requests meeting the specified criteria, by the time used to respond to each of those requests (in minutes), and by the cost of creating those responses (in the appropriate currency). By default reporting is by count, but sometimes time or cost is a more relevant measure of what you want to report. For example, to know how busy a service point is, the time spent on each request is a better measure that the number of requests.
So, where you have the Time type/Cost type code table/s enabled, and Time spent or Cost would be a better measure, you can use this parameter to report by those attributes. This option is only available for data sources “Questions” and “DeskStats”. It is also not available (and so does not appear) for the “Questions plus DeskStats” or the “Client only” Data sources, or for some reports like the Raw extract report where it is not relevant, or for some inapplicable tables like the Resources and Categories.
When you choose Time or Cost at Total type, the resulting report includes the total type in its name to make it clear that the totals are minutes or the appropriate currency. As Count is the default, there is no total type indicator in the report name.
X or Y axis Time reports: When these line/s appear it allows you to determine the X or Y axis time period grouping e.g. day provides statistics for each day during the period you specify, whereas month reports statistics accumulated over each month during the period you specify. Analysis is done according to the time zone of the signed on user. See below for further information about X and Y axis parameter choices.
X or Y axis other reports: When these line/s appear it allows you to determine the code tables to be uses as the X and Y axis for you report period grouping e.g. staff provides statistics for each staff member, whereas request type reports statistics based on the Request type of each request.
Output method: Choose an option to determine how the output will be presented – displayed on the screen, immediately downloaded to a file, or, two options that mean less time locked in the Statistical reports screen – either displaying a link to the file on the screen, or emailing the link to yourself or other email addresses:
Display to show the information you select using these parameter options, on the screen – formatted text (bold, coloured, etc.) is shown formatted, and the question number and attachments are hyperlinked. This is the best output to use if you need to see HTML formatted data and use the links it provides.
Display output can be cut and pasted to other programs such as WP and even Excel (but beware – functions like sort cannot be used with this data in Excel as Excel does not support HTML). Use the specialised Excel output format if you need to do further manipulation in Excel. Dates and times are in the time of the logged on user and appear in a human readable format e.g. 1/01/2016 11:13 AM.
If you choose Display, the parameters for generating reports will display, should you want to re-use them.
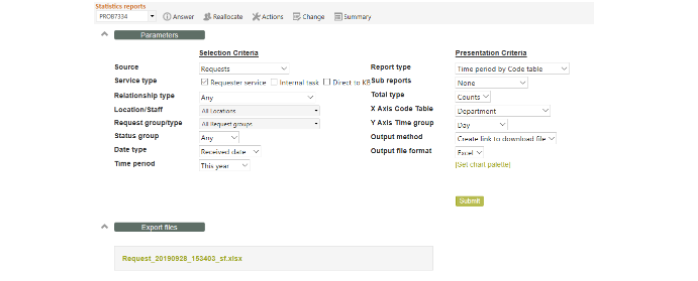
Auto-download file creates the results in the “Output file format” you choose (Excel, CSV or XML) and automatically downloads the results. Use this option if you want to use the results immediately, such as reviewing them in Excel.
Create link to download file this option saves time as you do not have to wait for the results to download. When the report finishes running (in a fraction of the time that it takes to also have the file downloaded), a clickable link to the results, in the “Output file format” you choose (Excel, CSV or XML), is displayed in the screen. This link is handy if you want to link the results into a document you are writing, or if want to make a .csv file available for another application to access the data. You can click the link to download the data and view it, or right click the link and use “Copy link” to make that download link available to other users or applications. The link goes to a copy of the output that is saved in RefTracker for Parameter 0.3 amount of time (usually 45 days).
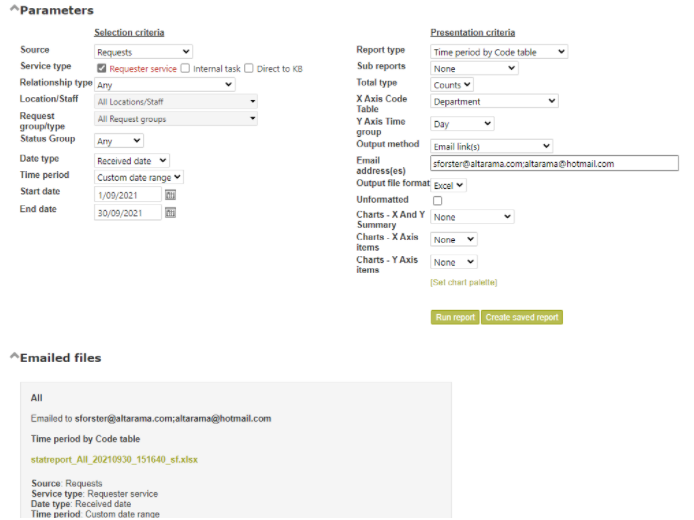
Email link(s) and Email file(s) these options make it easier to share the results of reports, save time producing them, and make it easy to pass the results on to others! A lot of the time that you wait for a report is related to downloading the results, and these options mean you no longer have to wait for the download. This option is never offered for General or DeskStats users.
These options display a confirmation message when the file, in the “Output file format” you choose (Excel, CSV or XML), has been emailed.
If you choose Email link(s) the email that is sent just contains a link to the results file – this is the best option if the file is not necessarily going to be viewed, or the file is very large as, without the file attached, the email arrives fast, and takes up much less space in the recipients mail box. However the file only remains available for viewing for parameter 0.3 amount of time (usually 45 days). The email the end user receives will state how long the file will remain available for (and of course they can view it, then save it locally for a permanent copy).
If you choose Email file(s) the email that is sent includes the file as an attachment – this is the best option if the file is going to be viewed immediately, as the attachment is already downloaded when it arrives.
When using this option an Email address(es) field will display. The signed on user’s email address will always be automatically inserted in this field, but you can add other email address/es (semicolon separated) to receive this particular run of this report/extract.
If you then create a saved report from your parameters, any email address/es you have specified will be copied into the saved report parameters, as the saved report is created, and any changes to the email addresses at the saved report level will only be applicable to the saved report/extract.
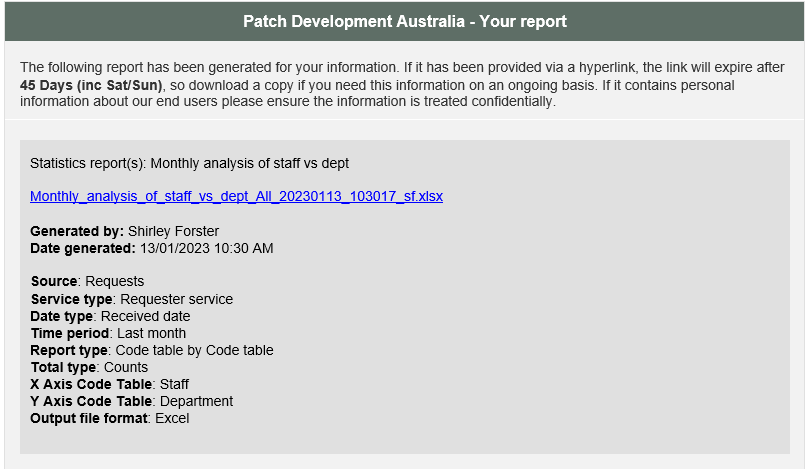
Here’s an example of the email that is sent by this process. The format of this email is not based on a template so it cannot be changed, however, you can edit the email before forwarding it on to anyone else.
If you choose any of these last four options, an “Output file format” parameter will display.
Output file format: If a file is to be created by the option selected at “Output method”, this additional parameter will display that allows you to choose the format of the output file:
Excel Choose this to obtain the information in an Excel spreadsheet format – to meet the needs of Excel, text is not formatted but the question number is hyperlinked back to RefTracker. Dates and times are in the time of the logged on user.
The Export options are important because they allow all the data collected in RefTracker about the selected questions, to be taken out to a separate reporting product (like Excel) where ad-hoc analysis and graphing options not provided by the standard RefTracker reports, can be performed.
CSV Choose this to obtain the information in a CSV compliant format. Dates and times are in ISO standard which means that the dates are in the date and time of the logged on user, but also show the UTC offset (in the format YYYY-MM-DDTHH:MM:SS+hh:mm where hh:mm is the offset) e.g. 2016-01-01T22:13:37+11:00. HTML coding used in data fields is included as encoded data as it is generally used for computer to computer transfer of data.
XML Choose this to obtain the information in an XML formatted file for use by other applications. Dates and times are in ISO standard which means that the dates are in the date and time of the logged on user, but also show the UTC offset (in the format YYYY-MM-DDTHH:MM:SS+hh:mm where hh:mm is the offset) e.g. 2016-01-01T22:13:37+11:00. HTML coding used in data fields is included as encoded data as it is generally used for computer to computer transfer of data.
Sample only: Tick the “Sample only” box to limit the displayed output to the first 25 records only. This is very helpful when testing reports, so you don’t have to wait for large data sets to download! Its also used for displaying scheduled reports/extracts where you don’t want to have the entire report run before you see what it does! It is only applicable when Output method is display.
More about X axis code table: This option only appears for some report types, allowing you to select the column values for your report. Choose the code table for which you want to report statistics, for example choosing Request type will provide statistics for the chosen period, for each of the different sorts of requests that were handled during your selected period. As code tables can be used differently in different RefTracker systems, in order to interpret the results of these reports you need to be familiar with the what the codes stored in each table mean, and how they have been used in Request form design in your RefTracker system, and in your DeskStats screen.
Not all X and Y axis options are valid for every report. You will see a validation message if you try to run a report with an X or Y axis value or combination that makes no sense.
The name and description for a code table should identify what it has been used for in your system, as code tables can be appropriately named. Question code tables are available for reporting whenever the X axis is provided. Client code tables (except Client location) are also available for reporting on Full questions only. Code tables are not just used for code tables – they are also used for multi list fields and for may system attributes like Locations, Statuses, Response method, and much more.
The standard use for each field is described in the Data fields in the Request forms where it is used, and Details tab help page.
More about Y axis code table: This option only appears when you are selecting a Code table type report, and allows you to select the row values for your report. Choose the code table for which you want to do two way analysis, for example choosing Staff when the X axis is Request type will provide an analysis of what request types each staff member has been handling during your selected period. Question code tables are available for reporting whenever the Y axis is provided. Client code tables (except Client location) are also available for reporting on Full questions only so far.
The resulting report will have columns and rows, as selected by your x and y axis choices, for each code table value that was used in the questions being reported on. So columns/rows only appear where there is a value to report and the columns/rows will appear in order specified by the sort order of the appropriate code table.
In some instances a value for your selected code table may not have been recorded for some of the questions being reported on. In this instance a “None” column will also appear showing the total number of questions for which no value was recorded for that code table.
Note that the code tables available for reporting under Question statistics and DeskStats are different. In particular, for DeskStats you can report on the Comments entered through the DeskStats screen.
Also note that any number of Categories and Resources can be recorded in association with a request, so the totals for reports about the Categories and Resources code tables do NOT represent the total number of questions received during that period (whereas fields that are recorded one per question such as Location, Staff, Age/Group, etc. all give the total number of questions received during the selected period). Also note that when reporting on Categories or Resources the date period you select will refer to the date on which the Category or Resource was added to the question, NOT the date on which the question was received or closed!
Charts
Use of the Charting parameters is optional and is only applicable when Output type is Display – leave them set to None if you do not want charts.
Charts – X and Y Summary provides two charts — X vs Y and Y vs X charts of the type that you select at this parameter – options are pie, line, bar and column charts, plus stacked Column and stacked Bar charts.
Charts – X axis item provides individual charts in the format that you select here – one for each of the X values – options are pie, line, bar and column charts
Charts – Y axis item provides individual charts in the format that you select here – one for each of the Y values – options are pie, line, bar and column charts.
[Set chart palette] allows the colours used by the charting process to be customised to meet your corporate needs.
More information is provided about Charts in the following section called Graphing any of these reports.
So these parameters allow you to choose the data and then the report type, and now we are going to look at each different report type, and the difference between Display and the different Export (download) output types, so you are familiar with what each does.
Creating Saved (and scheduled)reports
Whenever you are seeing report results in the Statistical reports screen, the Create saved report button appears in the top right of the Run report button.
Click this link and a screen will display that allows you to give the parameters you used for this report a name so they can be reused. Once this has been done Supervisors and above can even Schedule the report to be automatically run at a specified frequency and the results emailed to you or any other email address/es you specify.
Your saved report will be able to be run from Reporting>Statistics reports>Saved searches.
Scheduled reports are indicated in that menu list with an indication of their frequency in brackets e.g. (Wk) for weekly, but can also be run manually at any time.
For details of how to save (and optionally schedule) reports using this option, and manage all your saved reports, see details in the Saved reports help page.
System administrators can prevent staff from using this function by denying it in their user signon Functions tab (Deny “Scheduled reports and extracts” in the Searching and reporting division).
Exercise for users of live systems with interesting data to review:
Try using these parameters.
Notice how, as you choose different Sources, different reporting options are presented (as appropriate to those data sources).
When you are happy with the report parameters you have provided in this screen, click on Submit and your report will be run and displayed at the bottom of this screen under a Results heading.
Every RefTracker system is set up differently, so the reports that are important to you will be different to the reports that are important in other RefTracker systems. It is important that you think carefully about how you use your RefTracker system, when setting reporting parameters. Try lots of reports! The results are most meaningful to you, as you understand your data best, but your RefTracker support representative can help you with choosing the right parameters to achieve the analysis that you want to achieve.
Try producing reports for each of the report types (as selected in the Presentation criteria section) with different parameters. The following information will help you understand the data being presented by each report type.
Try saving a report that you want to use regularly – should if be scheduled to run automatically?