Report type – Time period by code table (display)
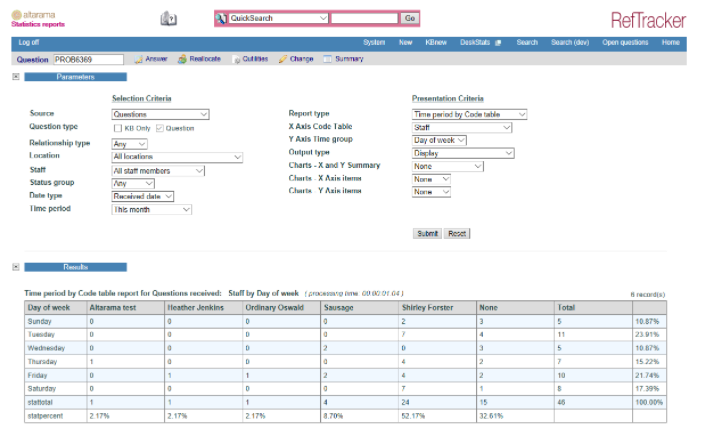
The Time period by code table report shows the time period you have chosen on the Y axis (in this case days were selected), and the code table that you have chosen on the X axis (in this case Request type was selected).
It allows you to analyse the incoming or outgoing traffic from your RefTracker system (for the whole system or separately for full questions and DeskStats), by specified time periods within your selected time period – for example “how many questions were handled by each staff member each day during the selected time period”, or “for each month within the selected period, how many questions of each different request type were answered”.
The Time period report is available for all data sources: Questions plus DeskStats, Questions, DeskStats, and Client, and analyses data according to the time zone of the signed on user.
As the Location field information is gathered only once for each full question, the statistics you see here are usually the total number of full Questions handled during that period. Beware, however, some fields (Category and Resources) can have multiple entries per question, and when you do statistics on these types of fields the total shown does not relate to the total questions handled during the period, but rather the total Category or Resource selections made for all questions handled during that period.
Remember that the meaning of the code tables you are analysing is as you have used them in your system. Go to the Code tables screen and view the description/contents of each code table to recall why each field is used in your library, to determine what analysis can be done using this screen.