Reporting – Completion Summaries
The Completion summaries screen is accessible from the staff home page and from the Reporting menu in the main header bar, by Supervisors and Administrators only. It provides a set of standard metrics (reports) for the Location/s and Time period selected in the parameters, that show helpful information about the work that has been completed in the selected period (Closed question only – not even Rejected question or Not a service questions) – where questions are coming from, what types of questions are being handled, and how many are being completed. If you use both full questions and DeskStats it will report on the total of completed requests for both full questions AND DeskStats.
Statistics reports compliments Completion summaries by allowing libraries to do a wider range of other reports, as well as exporting data for external analysis.
My statistical overview provides similar information about closed questions as Completion summaries, but for the signed on user only.
Note that the system remembers the parameters that you used last time and represents those same parameters next time this screen is used. This makes rerunning reports for different time periods very easy. Not all parameters are applicable to all reports so some parameters cannot be saved – be sure to check your parameters before clicking Submit!
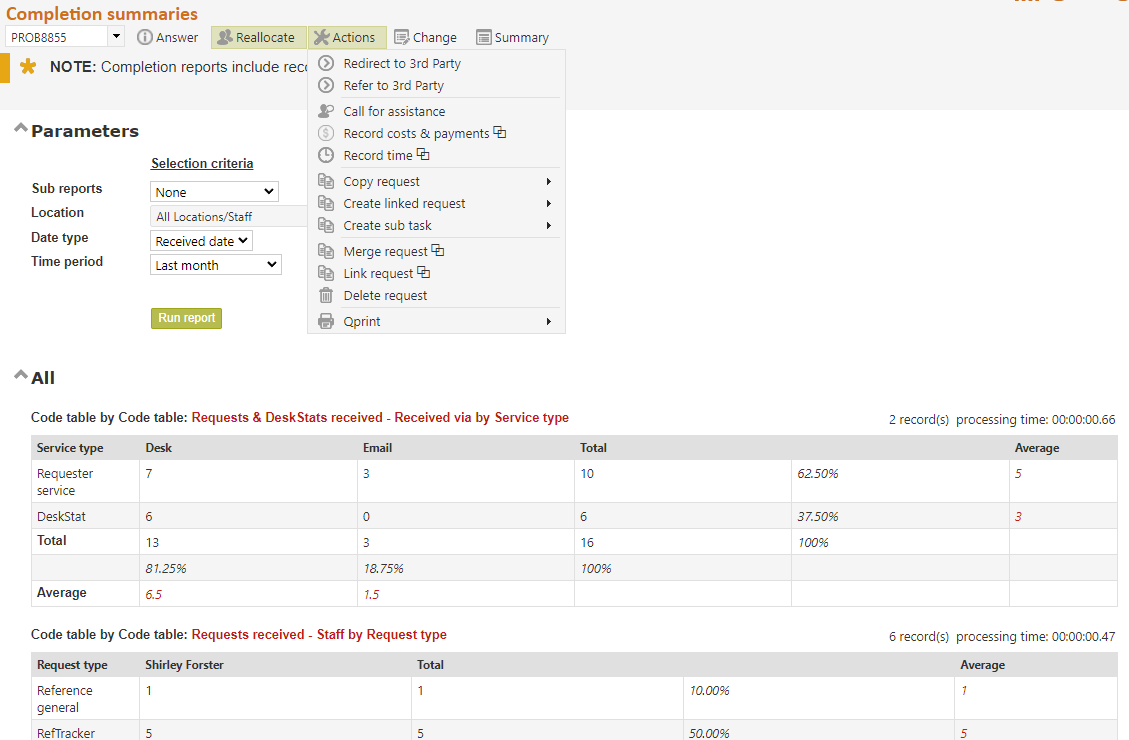
The parameters that you can set to obtain this set of reports about requests closed by your service, are as follows:
Sub reports: Choose to report on all closed questions as one total report, or have individual reports by each individual Location, each Staff member, or each Service type.
Location: Often you only need to report on the statistics for one of your locations, or you want statistics for all Locations, but broken up by each of your library Locations.
Choose a specific Location, or All locations for a total of all of your Locations, or choose Each location for subtotals by each library location with a total for all locations.
Date type: Choose whether the start and end date will refer to the date on which the closed question was received or the date on which it was closed. Closed date is default as it is the most sensible choice when you want to know the cost of developing answers, but Received date is sensible for measuring incoming workload.
If you choose Closed date, the system will match the statistics report by Statistics reports with these parameters (so it does not include questions in statuses like “Rejected” and “Reopen requested”, and the like, that are not actually a “Closed” service):

Time period: Choose the time period for which this report should be run, such as “This week”, or choose “[Custom date range]” and then set the start and end dates you want to use.
Start and End date: If you have chosen Custom date range at Time period, enter the starting and ending dates for which you want to report statistics. These dates are inclusive.
The reports provided are:
- Questions and DeskStats: Received via by Question type: provides an analysis of how all the questions for the selected period (full questions and DeskStats i.e. your entire workload recorded in RefTracker) were received e.g. by phone, web page or at the Service desk.
- Questions: Staff by Request type: provides an analysis of what types of requests staff have been responsible for during the selected period, that were handled as full questions.
- DeskStats: Staff by Request type: provides an analysis of what types of requests staff have been responsible for during the selected period, that were handled as DeskStats.
- Questions and DeskStats: Staff by Request group: provides an analysis of the total question handled over both full questions and DeskStats for the selected period, analysed by the broader grouping of Request groups.
- Questions and DeskStats: Status group by Question type: provides an analysis of the current status of all the questions (full and DeskStats) for the selected period e.g. open, in review, closed. (Note for this information to be accurate the report must be run as close to the end of the selected period as possible.)
- Questions: Request group by Target date: provides an analysis of how well the questions that were entered into the system in full, were responded to in relation to their Target response date (i.e. how well service objectives were meet).
- Time expended on DeskStats by Request type: provides an analysis of how much librarian time in minutes was spent on answering questions recorded in DeskStats for the selected period (add to the previous report to get total for your system).
- Time expended on Questions by Request type: provides an analysis of how much librarian time in minutes was spent on answering full questions for the selected period (add to next report to get total for your system).
If a report has zero to report, it does not show – in this way this page remains succinct and to the point, even if you organisation only uses full questions or only uses DeskStats.
Exercise for users of live systems:
The parameter you want to use, may already be showing. If so, just click Submit to see the results.
If not, choose the Location/s that you want to report by.
Then choose whether you want to report by on closed questions that were received during the selected period, or closed during the selected period. (Questions closed during the period is the usual and most sensible selection).
Then choose the time period you want to use. If you specify starting and ending dates for your report, the dates you choose are inclusive. If you select this week or last week, the system will return results for Sunday to Saturday as per your selection in parameter 2,18.
The Completion summaries report that shows when you click Submit shows you the basic statistics that everyone wants to know about requests closed by their service.
Read on to find out about other reports that can tell you more about the operation of your service.